Official Step-by-Step User & Administrator Guide (v4.0)
Every section in this manual is organized into clear Step 1 → Step 2 → Step 3 → Step 4 workflows so executives, CFOs, territory directors, branch managers, purchasing buyers, and ERP administrators can connect data streams, build custom SQL views & fx measures, run Excel-formula FP&A forecasts, customize dashboard data grids, and govern users via reusable Territory State Roll-Ups and Custom Role Templates.
fxPlatform Architecture, Streamlined Header & Initials Avatar Menu
Built By Data delivers an end-to-end enterprise intelligence ecosystem hosted on a global edge network with strict multi-tenant subdomain isolation and a distraction-free workspace layout:
Prospects can test drive builtbydataanalytics.com/app using curated wholesale distribution benchmark data, while each production customer receives an isolated subdomain (<customer>.builtbydataanalytics.com) gated by token authentication, edge dataset protection, and Row-Level Security.
⊞ Menu)VantageBI Standard includes the 5 Core Operational Cubes (📊 Sales, 🏭 Purchasing, 📦 Inventory, 💵 Accounts Receivable (AR), 🧾 Accounts Payable (AP)). VantageBI Enterprise unlocks all 5 operational cubes plus 📑 Financial Statements, 🎯 Budget & Forecast, and 💰 Vendor Rebates & SPAs (all 8 Governed Suites) alongside Price Override Audit, 18 Executive Scorecards, Database Designer, and SQL Studio.
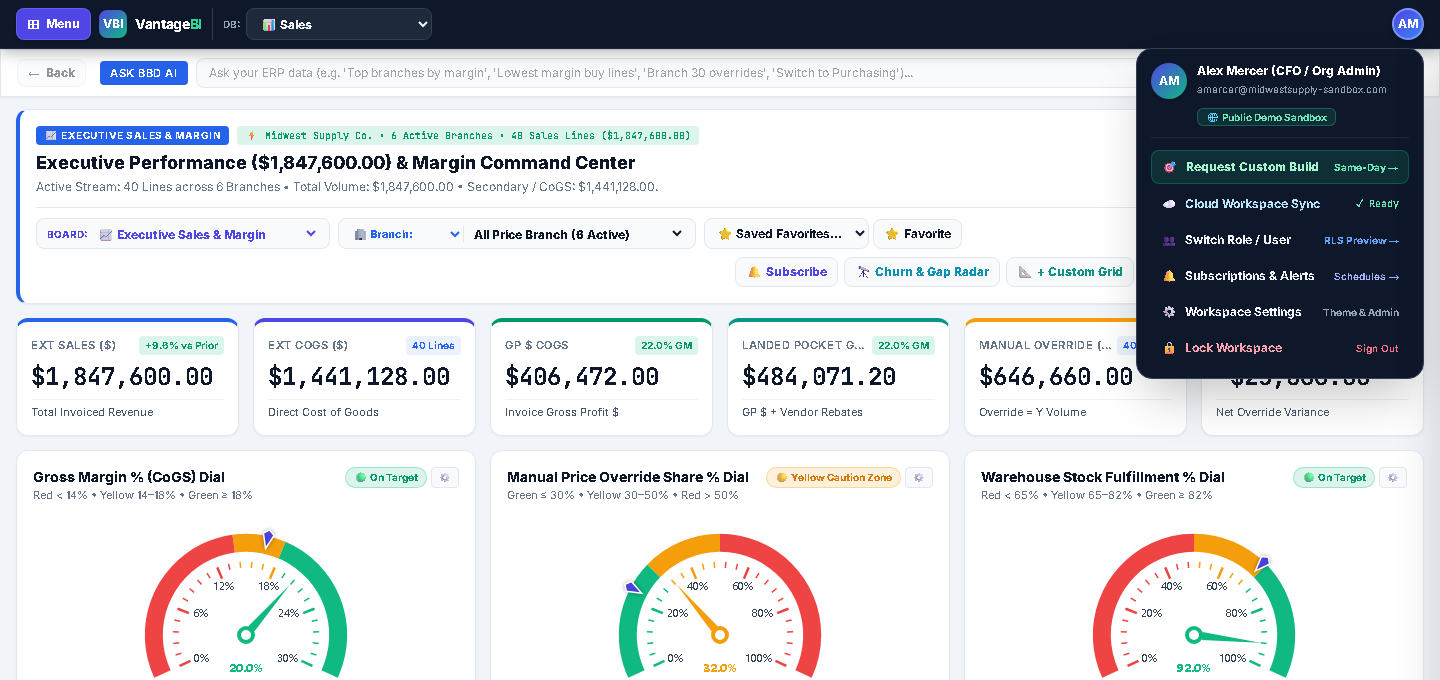
TP) & Branded DialogsThe top dark bar stays ultra-clean with a compact DB Selector (Sales, Purchasing, Inventory, Accounts Receivable, Accounts Payable) on the left and a space-saving Initials Avatar Circle (e.g., TP) on the far right. Click your Initials Circle anytime to view your full Name, Title, Role, active Territory/Branch RLS badge, 1-Click Switch Role, 🔒 Lock Session, and ⚙️ Settings / Theme Switcher (☀️ Daylight, 🏛️ Exec Navy, 🌙 Dark Mode). Every note, working line, favorite, and formula studio uses native branded VantageBI™ modals—zero browser system popups.
Day-1 Customer Onboarding Playbook (End-to-End in 4 Steps)
Follow these four sequential steps whenever provisioning a new distributor or manufacturer onto VantageBI™:
Point the On-Premises Sync Studio (or Cloud Connector)
Use the SQL Workbench (#sql) for any custom ERP table joins or
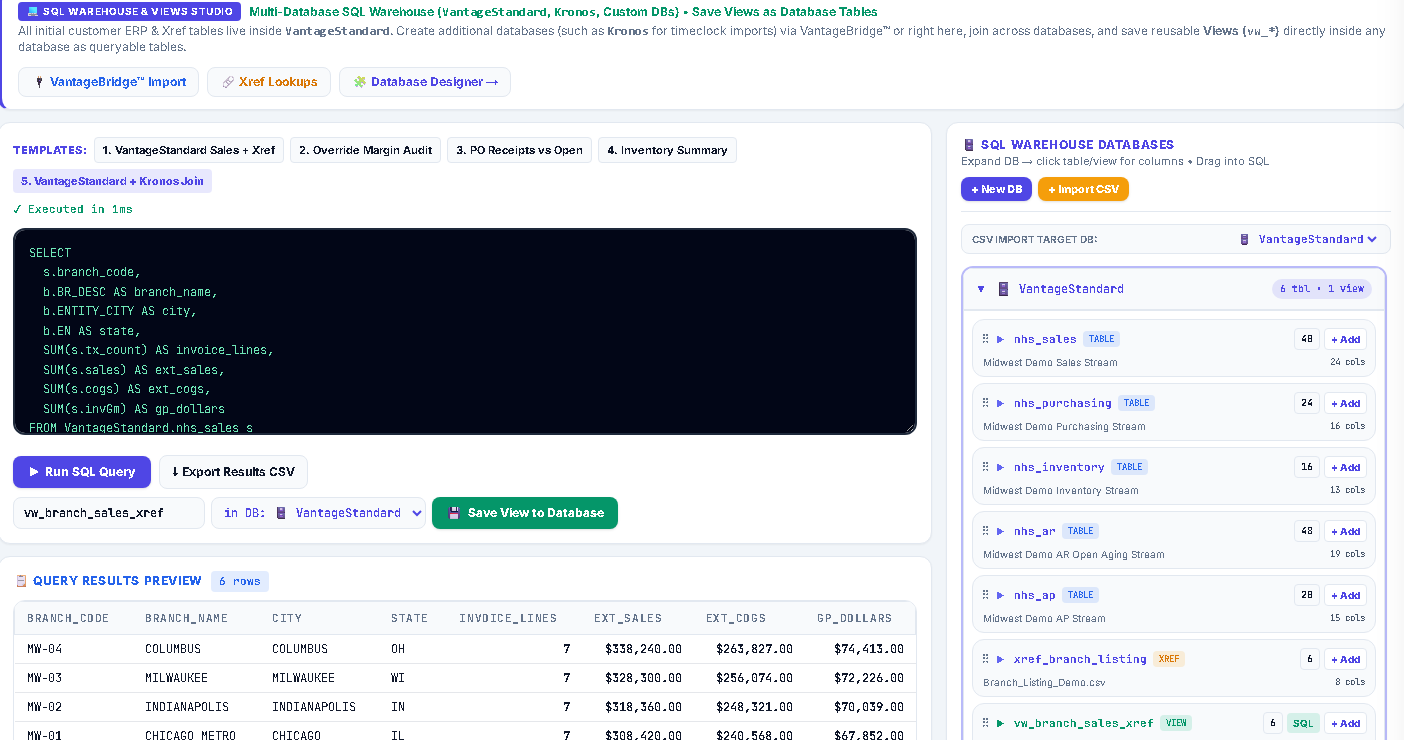
CASE WHEN logic, and attach Customer, Vendor, Buy-Line, and Branch State/Region master tables in Designer Xref.
Verify Dimensions, Properties, Custom Formula Measures
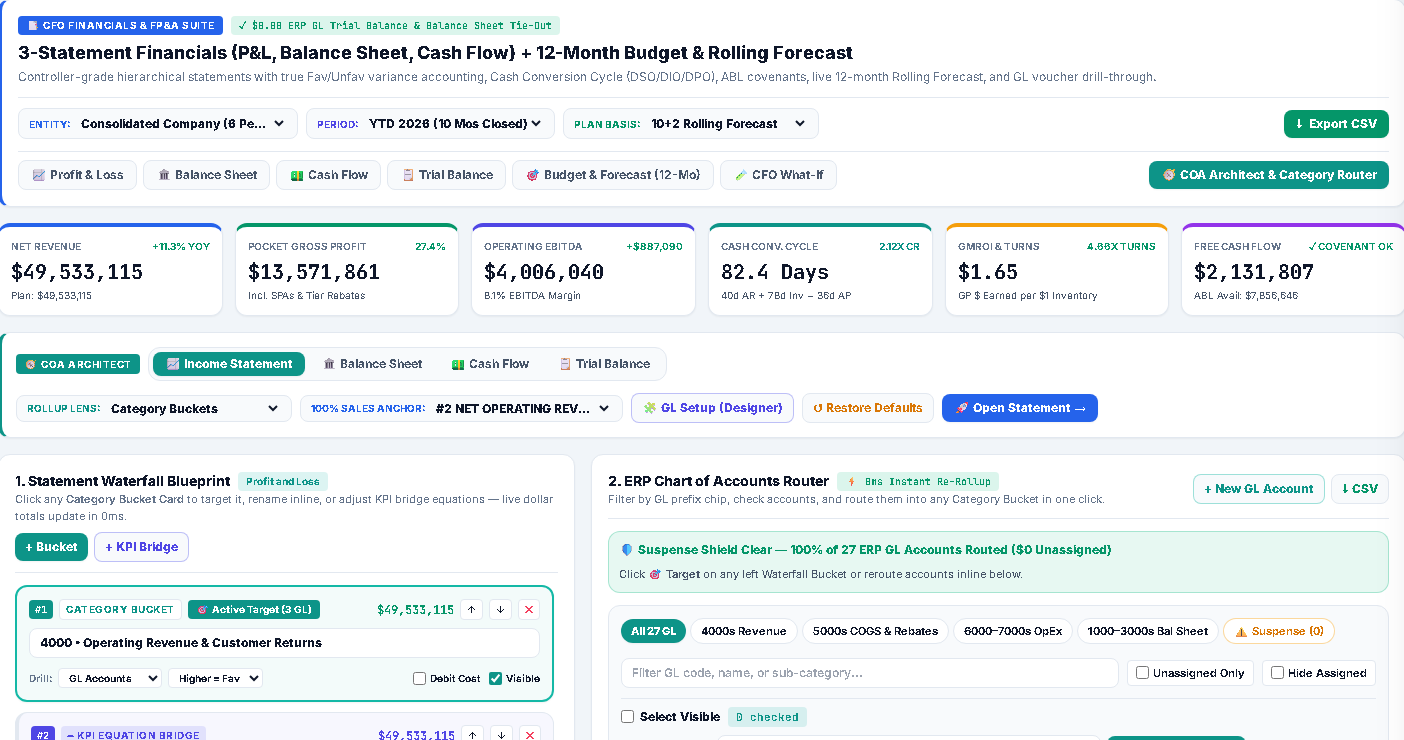
fx), and Fiscal Dates in Database Designer (#designer), import their Chart of Accounts CSV, and route GL categories in COA Architect (0ms).
Group US States into Territories
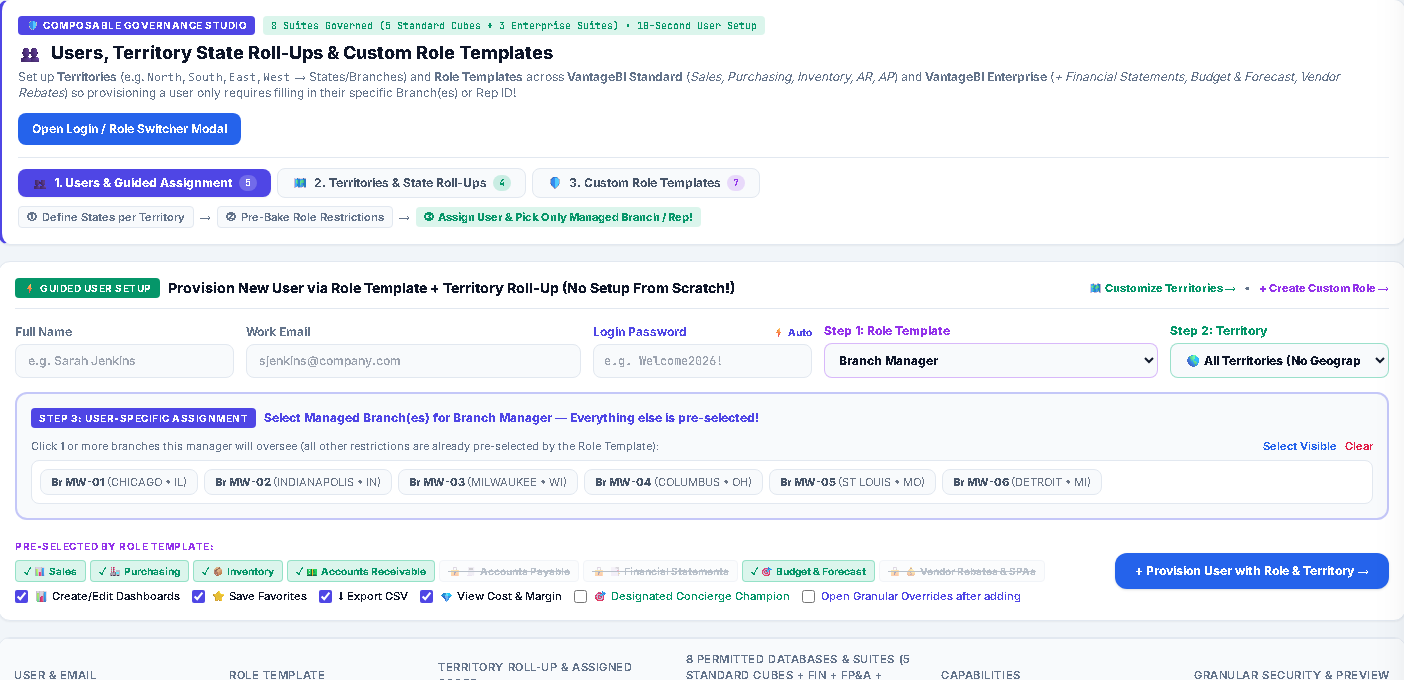
North/South/East/West), configure Role Templates across all 7 Suites, provision users in seconds in Users & Governance (#users), and verify 100% penny tie-out.
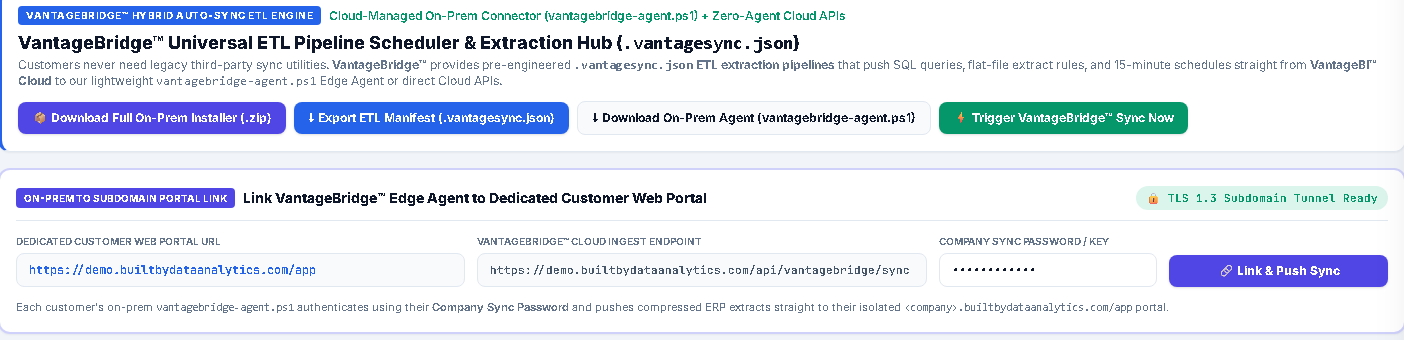
VantageBridge™ Hybrid Multi-Source Data Sync (Data Sync)
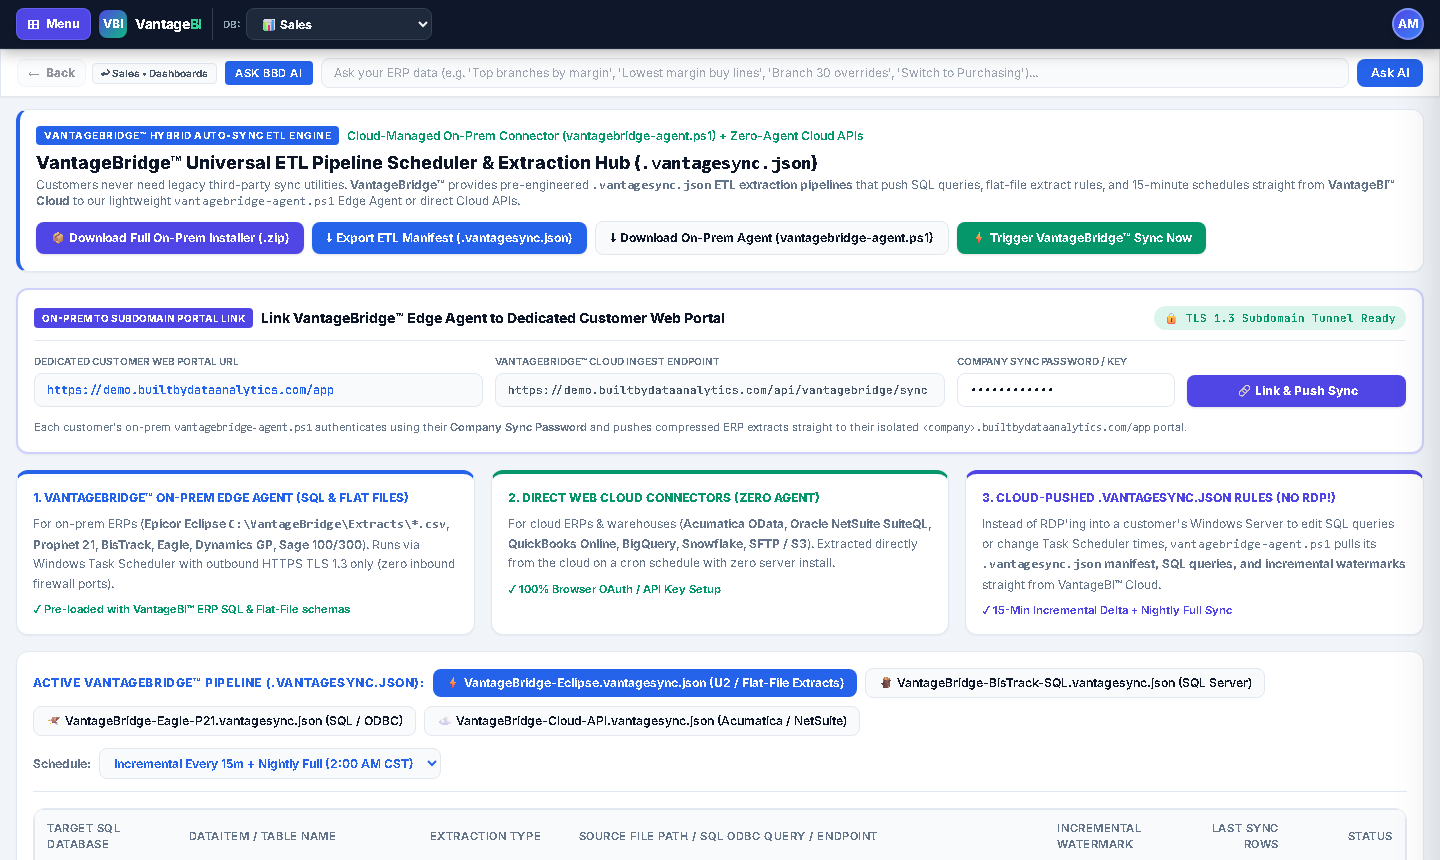
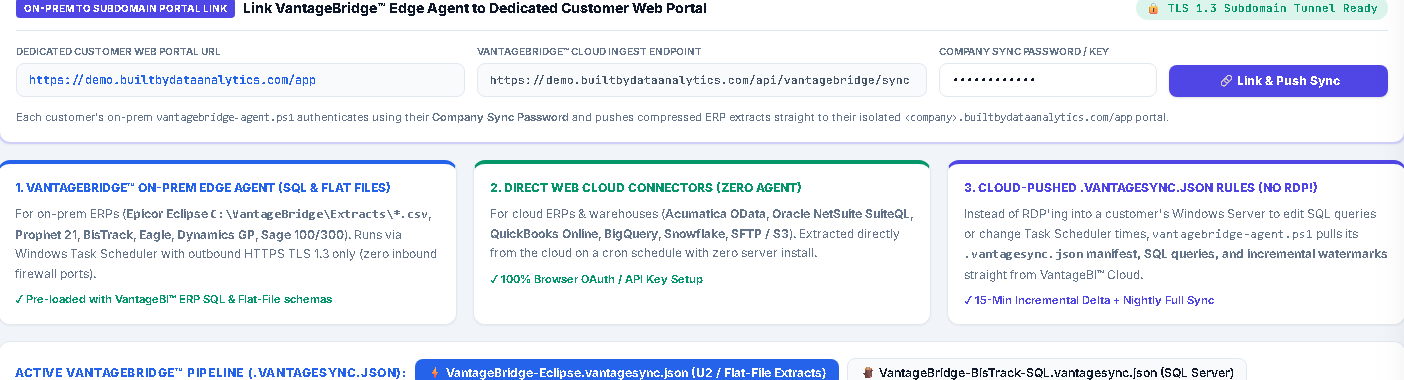
VantageBridge™ combines the reliability of an on-premises Windows Task Scheduler desktop GUI utility with zero-agent cloud API connectors across SQL, ODBC, Pick/Universe, SFTP, and flat files.
Step-by-Step: Connecting & Scheduling Customer Data Sources
/app.html#connectors) or launch the VantageBridge™ On-Premises ERP Sync Studio GUI on the customer's server. Click + Add Data Stream and pick the exact source format for each feed:
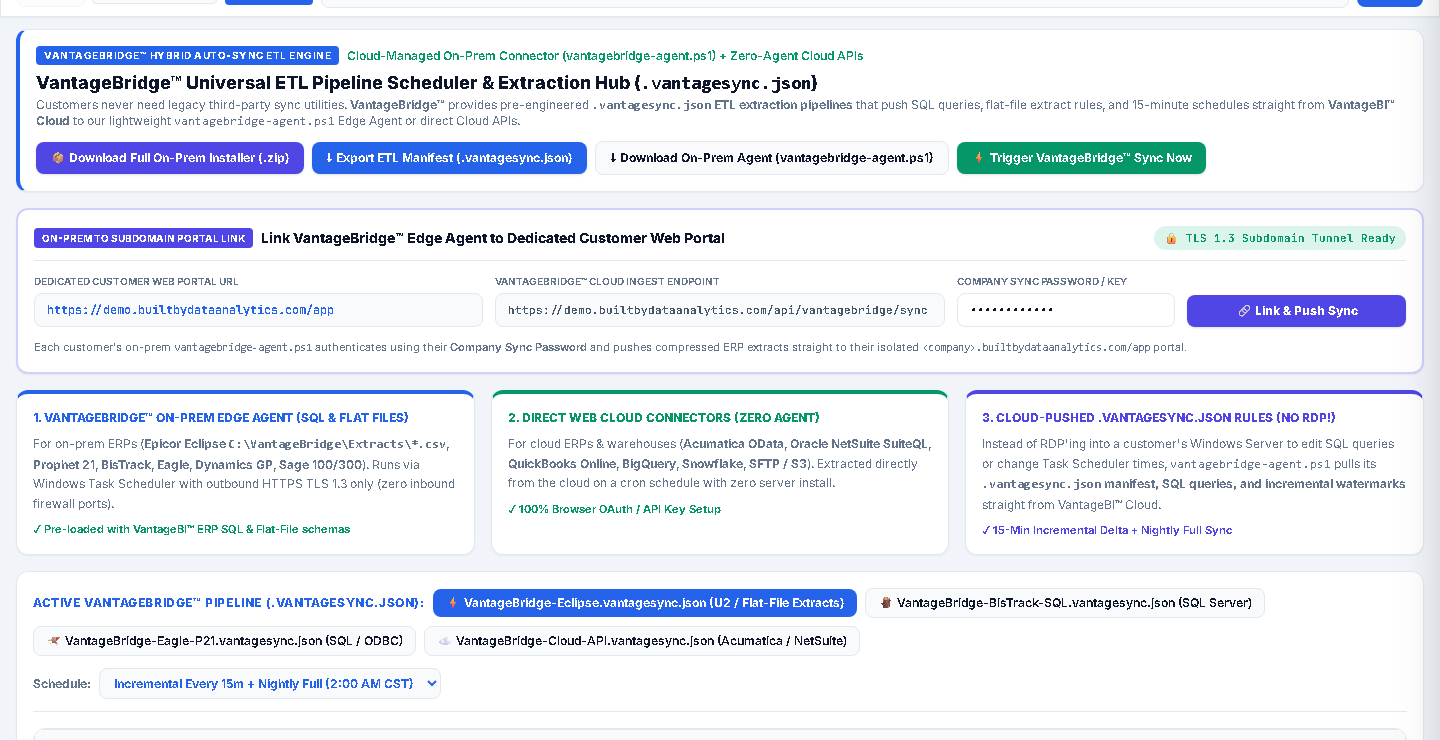
Invoice_Date, Recv_Date, Posting_Date) with Incremental Append for transactional streams (Sales, Purchasing, AP, GL Postings) or Nightly Snapshot for balances (Inventory On-Hand, Chart of Accounts Master).
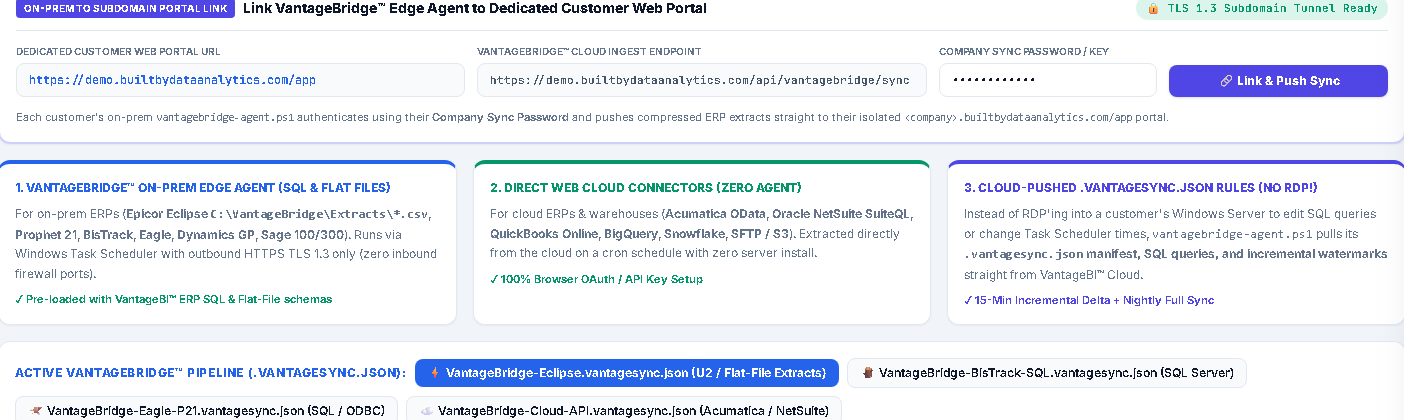
.vantagesync.json without needing to RDP into the server!
VantageStudio™ — Power-User SQL & Warehouse Views (SQL Warehouse)
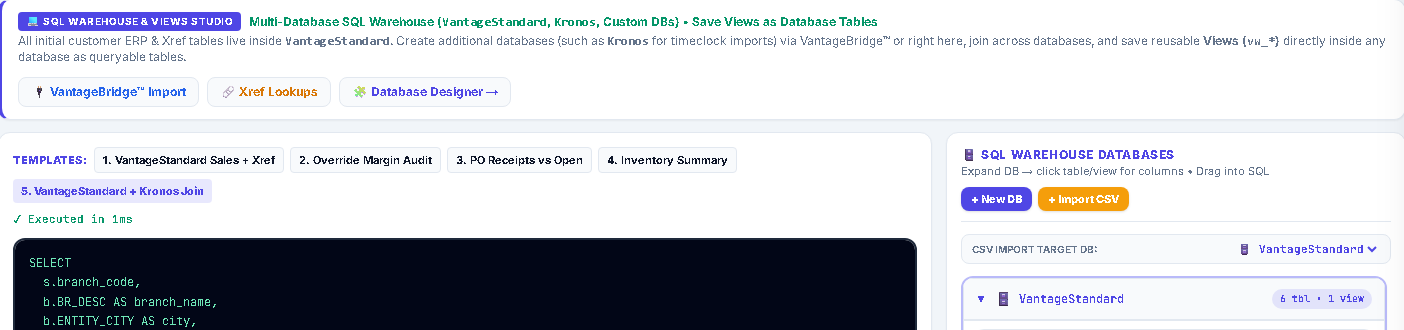
When an implementation architect or technical controller wants to write custom SQL joins, union historical ERP tables, or pre-aggregate complex logic before mapping a cube in Designer, the built-in SQL & Views Workbench (accessed via the left ⊞ Menu → Admin → SQL Studio) provides a complete browser IDE.
Step-by-Step: Writing SQL & Saving Reusable Designer Views
/app.html#sql). Expand VantageRaw (raw synced customer ERP tables/files) and VantageStandard (curated views) on the right panel. Click any table or column name to insert it into the SQL editor or preview its columns.
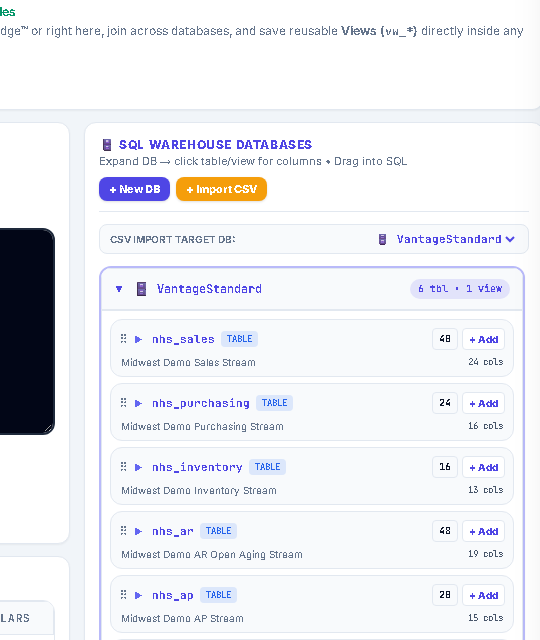
SELECT, LEFT JOIN, WHERE, GROUP BY, CASE WHEN, ORDER BY)—or click one of the 1-click starter templates—and press ▶ Run Query to inspect row counts, execution speed, and live tabular results immediately below the editor.
vw_sales_rebate_enriched), pick the target warehouse schema, and click 💾 Save as View. The saved view immediately appears in the right-hand schema catalog AND inside Database Designer's Stream Selector so you can build or extend cubes directly on top of your SQL view!
VantageStudio™ — Cube Builder, Kits/BOM/Recipes, UOM & Custom fx Measures
VantageStudio™ gives administrators unified control over SQL Warehouse Views and every operational and financial cube (Sales, Purchasing, Inventory, Accounts Payable, Financials GL, plus unlimited + New DB custom cubes)—including native Kits, Assemblies & Recipes (BOM), Multi-UOM / Catch-Weight Conversions, and 6 Universal Industry Vertical Profiles.
Step-by-Step: Mapping Streams, Xrefs, Custom fx, Kits/BOMs & Cross-Industry Verticals
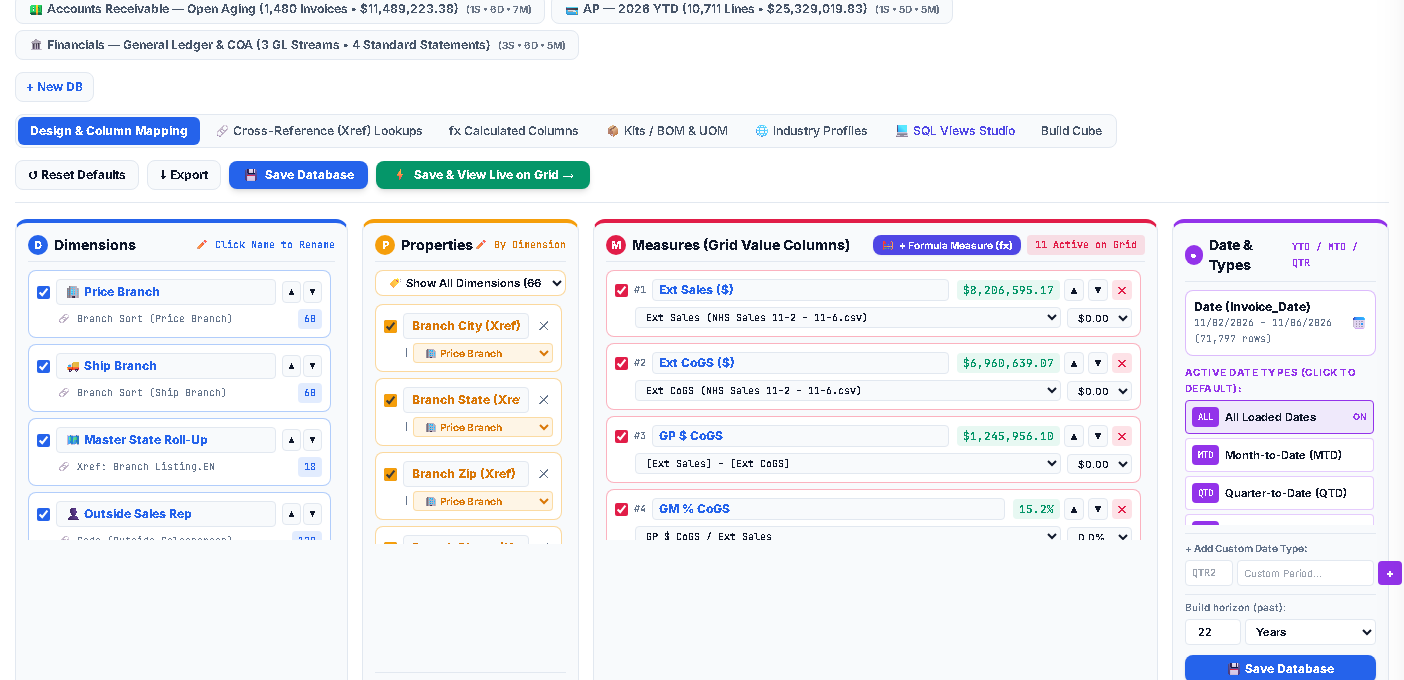
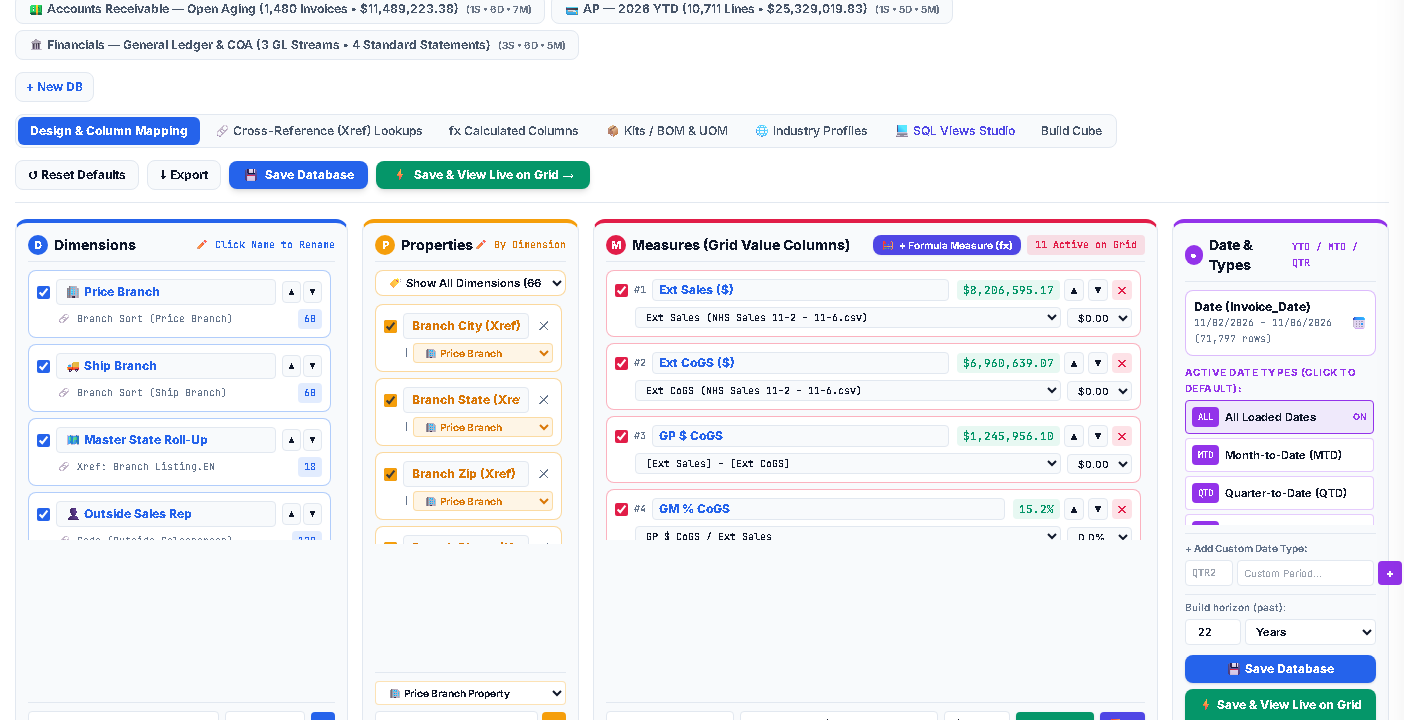
Branch Listing attaches Branch City / State / Zip / Phone / Operating Region to Price Branch, while Outside Sales Rep carries Home Branch / Role / Work Email / Direct Phone / Commission Plan, Bill-To Customer carries Trade Segment / Terms / Credit Limit / Assigned Rep, and Product SKU carries Buy Line / Manufacturer / Stocking UOM / Avg Unit Cost & Price. Use the Filter by Dimension dropdown in Bucket 2 to inspect, add, or reassign properties for any dimension!
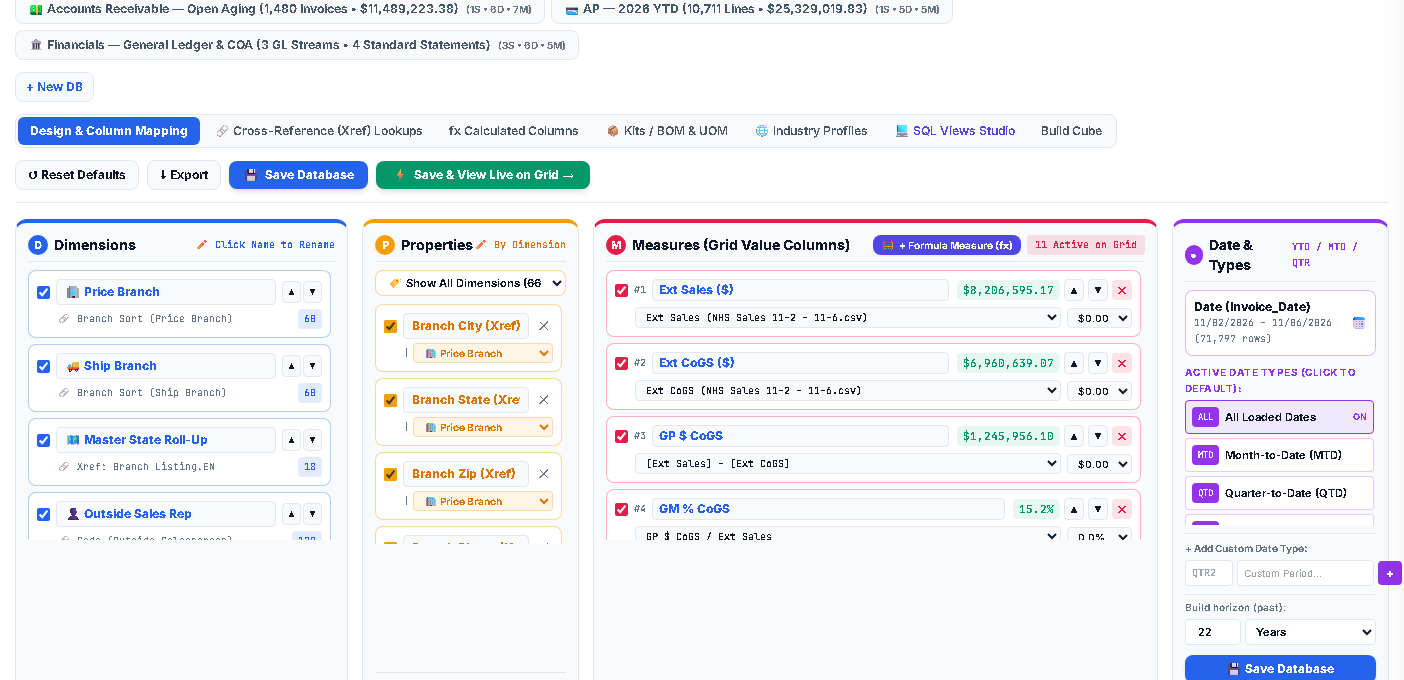
fx) in Bucket 3: Click 🧮 + Formula Measure (fx) inside Bucket 3: Measures (or inside the Grid Measures dropdown) to open the Custom Measure Formula Studio. Write any mathematical or conditional formula—including Wholesale Pocket GM %, Automotive Avg RO Ticket $, Net Margin After Core/Warranty %, Food Margin After Spoilage/Shrink %, or Catch-Weight Realized $/Lb—rolling up with exact weighted Grand Totals across Grid rows, Charts, Custom Grids, and CSV exports!
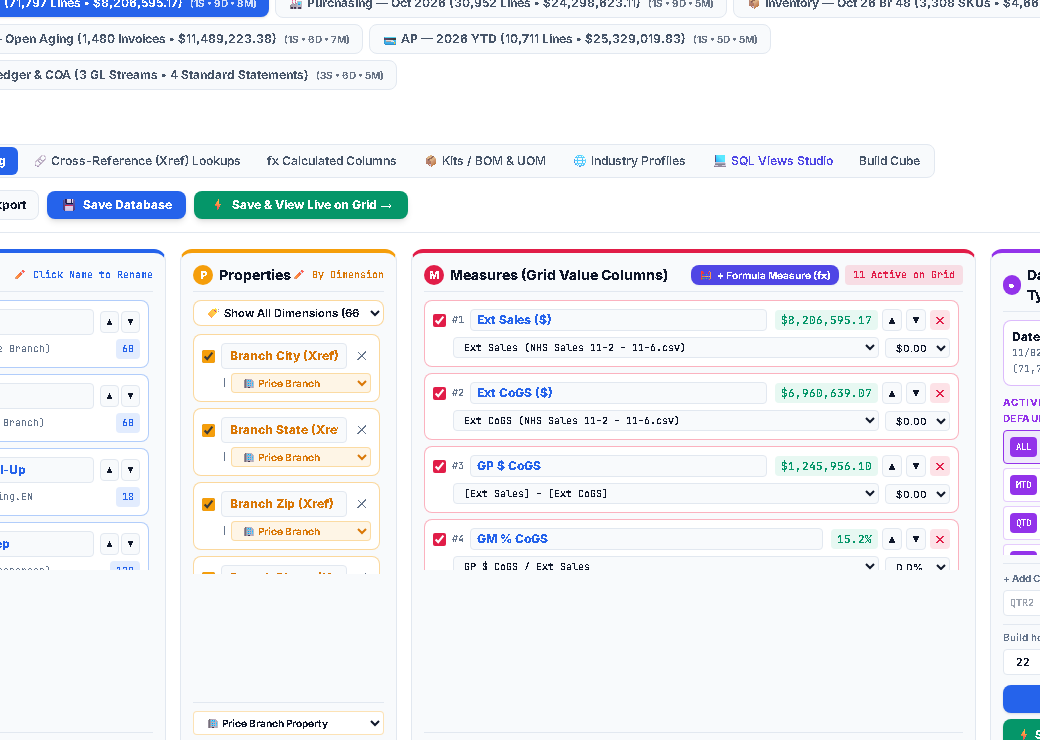
📦 4. Kits / BOM & UOM): Switch to the 📦 Kits / BOM & UOM sub-tab in Designer to solve header-priced kits vs. component costing across industries:
- 3 BOM Roll-Up Modes: Choose 1) Header-Priced Kit Cost Roll-Up (rolls component costs up to the Parent Kit SKU so neither parent nor child shows distorted 100% / -100% margins), 2) Component / Recipe Explosion (allocates kit revenue & Trim / Cooking / Scrap Yield Loss % down to raw ingredients/parts), or 3) Dual Parent + Child View.
- Live Buildability & Bottleneck Detection: Automatically computes
Max Buildable Kits/Casesright now and flags the exact Limiting Bottleneck Part + Multi-UOM & Catch-Weight Factors (Master Case ↔ Each,Subprimal ↔ Scale Lb,55-Gal Drum ↔ RO Quarts,Flat-Rate Flag Hr ↔ Clock Min).
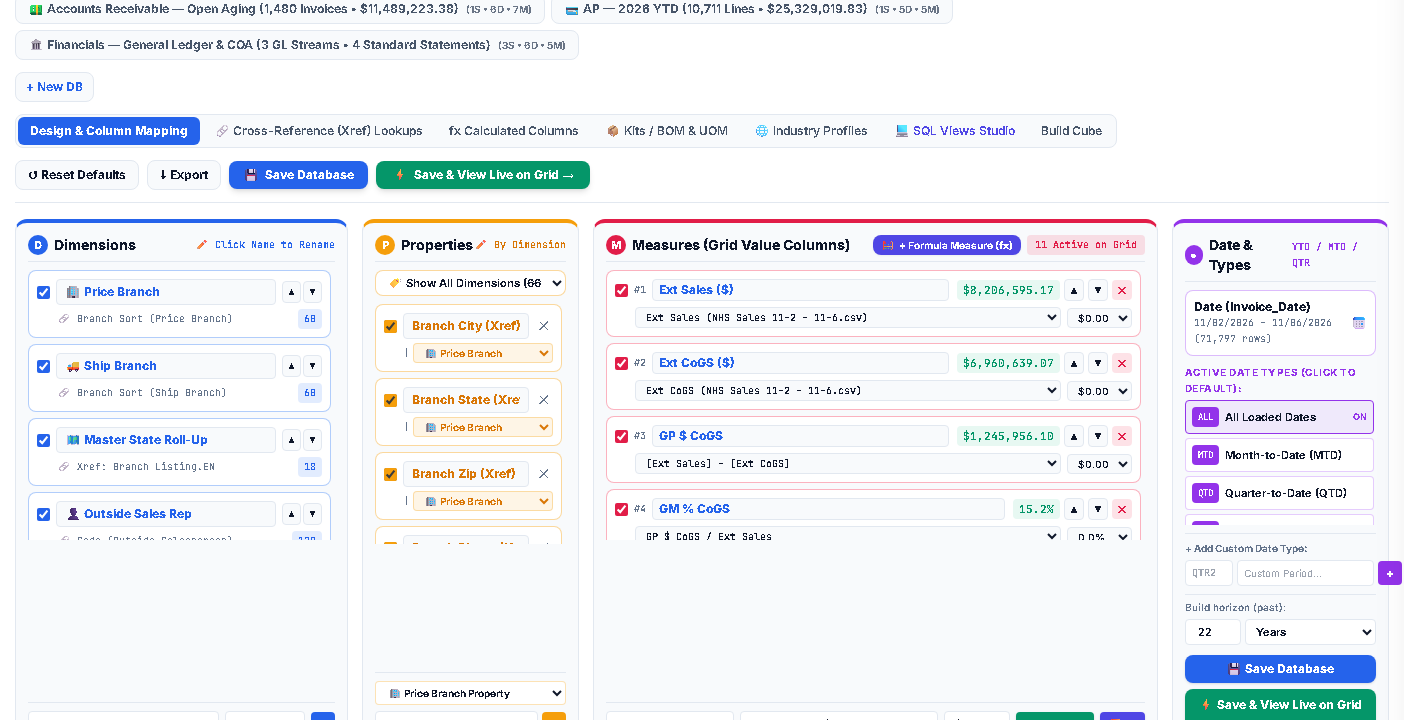
🌐 5. Industry Profiles): VantageBI™ serves any company in any industry. Select 🏗️ Wholesale Distribution (default), 🔧 Automotive / Auto Repair & Performance, 🥩 Food & Beverage / Cold-Chain / Restaurant, ⚙️ Manufacturing & Kitting, 🛍️ Multi-Store Retail & E-Com, or 🚚 Field Service & Contracting to inspect ERP connectors, KPIs, and relabel cube Dimensions & Measures in 1 click!
How to Set a Customer Up with Financial Statements & COA Architect
VantageBI™ makes customer General Ledger onboarding completely self-service across Data Sync, Database Designer, and the Split-Canvas COA Architect & Category Router—while guaranteeing a $0.00 Trial Balance variance from minute one.
In VantageBridge™ Data Sync (#connectors), enable the two standard General Ledger feeds from the customer's ERP:
GL_Postings_YTD.csv:Journal_Doc_No,GL_Account_No,Branch_ID,Posting_Date,Debit_Amt,Credit_Amt.GL_Chart_Of_Accounts.csv:Account_Code,Account_Description,Account_Type.- Optional:
GL_Budget_2026.csvfor 12-month approved budgets by GL & Branch.
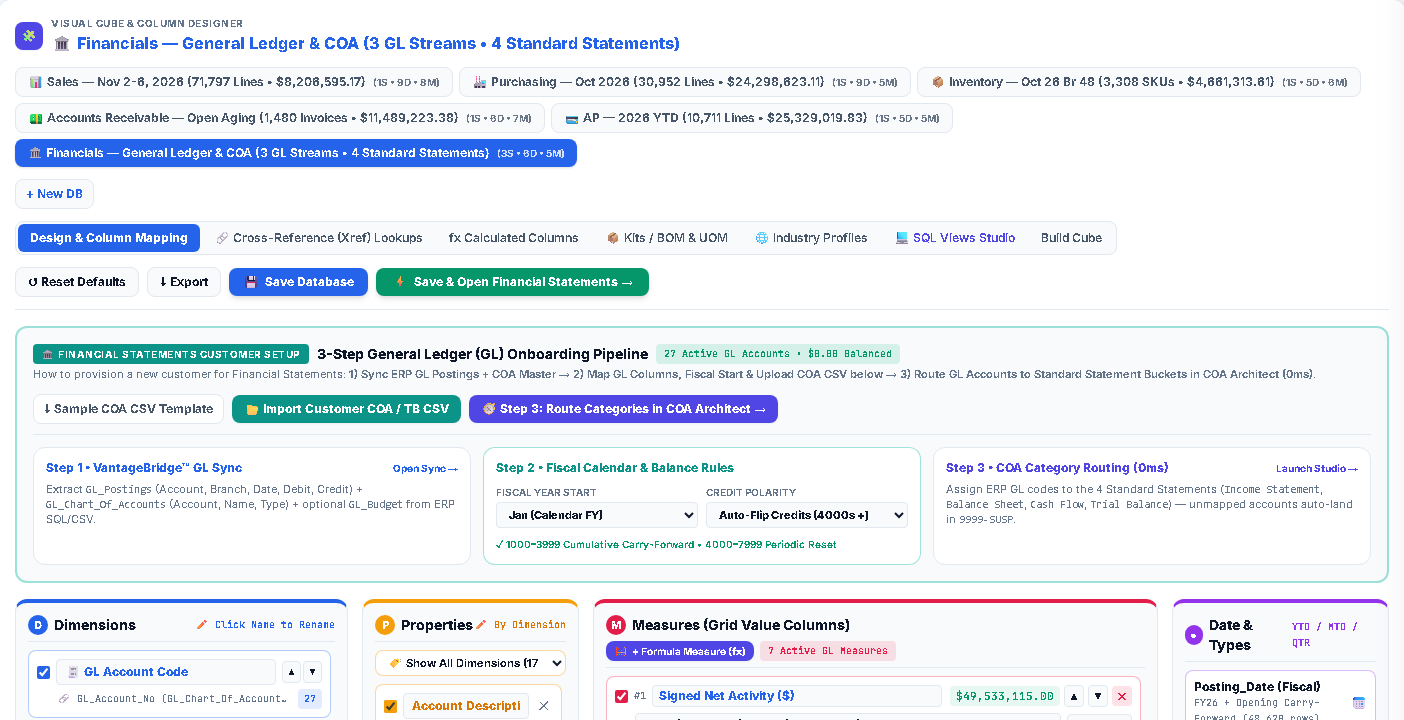
Open Database Designer and select the 🏛️ Financials — General Ledger & COA tab (or click 🧩 GL Setup (Designer) inside Financials):
- Fiscal Year Start Month: Choose
Jan(Calendar),Apr,Jul, orOctfiscal calendar. - Credit Polarity & Carry-Forward: Automatic
1000–3999cumulative Balance Sheet carry-forward vs.4000–7999periodic P&L reset. - Bulk COA CSV Import: Click ⬇ Sample COA CSV Template or 📂 Import Customer COA / TB CSV to load all customer GL accounts in seconds!
0ms)
Click 🧭 Step 3: Route Categories in COA Architect → to open the side-by-side Split-Canvas Studio:
- Auto-Prefix Classification:
4000s → Revenue,5000s → COGS/Rebates,6000s → OpEx,1000–3000s → Balance Sheet. - Automatic
9999-SUSPSuspense Safety Net: Any unfamiliar or newly created ERP GL account lands in Suspense with a warning badge so books never go out of balance. - Side-by-Side Blueprint + Router: Edit Waterfall Category Buckets & KPI Equation Bridges (
[2] - [3]) on the left while bulk-routing GL accounts on the right with zero rebuild lag!
CFO 4-Statement Suite, Excel-Formula fx FP&A Workbook & Cash Simulator
Step-by-Step: Analyzing Statements, Auditing GL Vouchers & Building Multi-Sheet Excel Forecasts
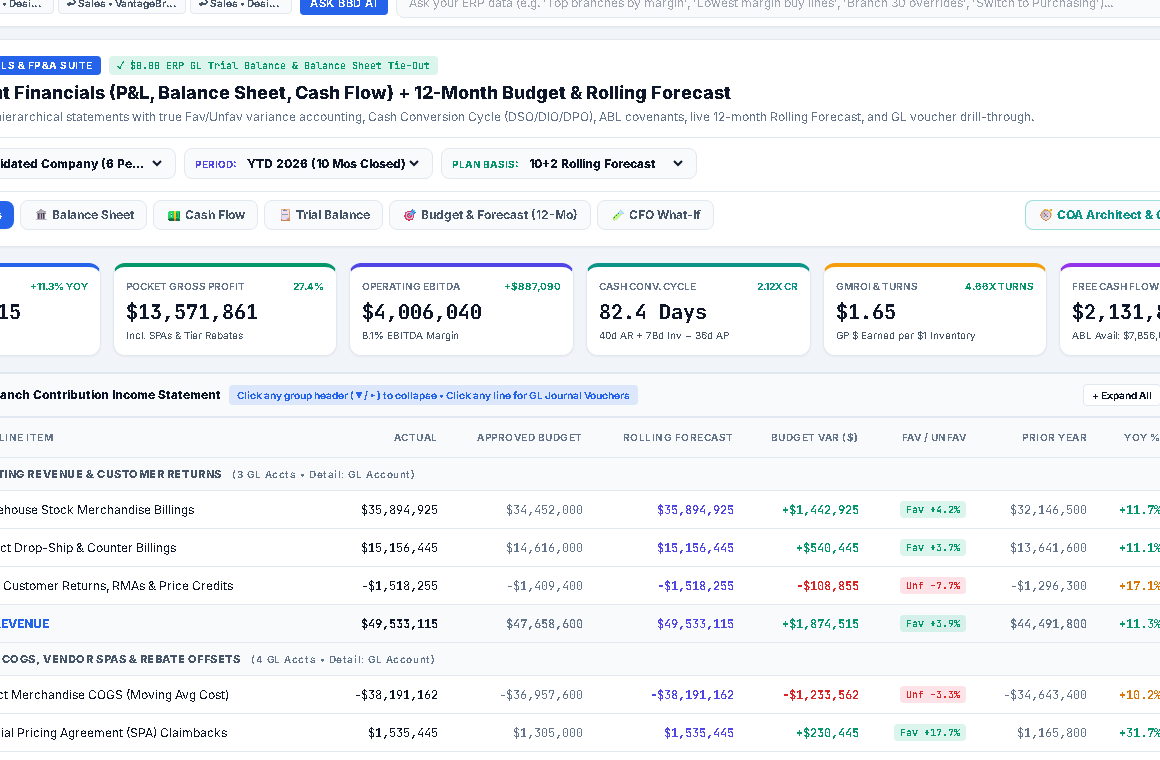
#financials) to view Income Statement (P&L), Balance Sheet, Cash Flow Waterfall, and Trial Balance. Select Consolidated Company, a Territory State Roll-Up (automatically scaled to that territory's revenue share!), or any individual Branch 4-Wall Profit Center across MTD, QTD, YTD, or Full-Year 10+2 Forecast.
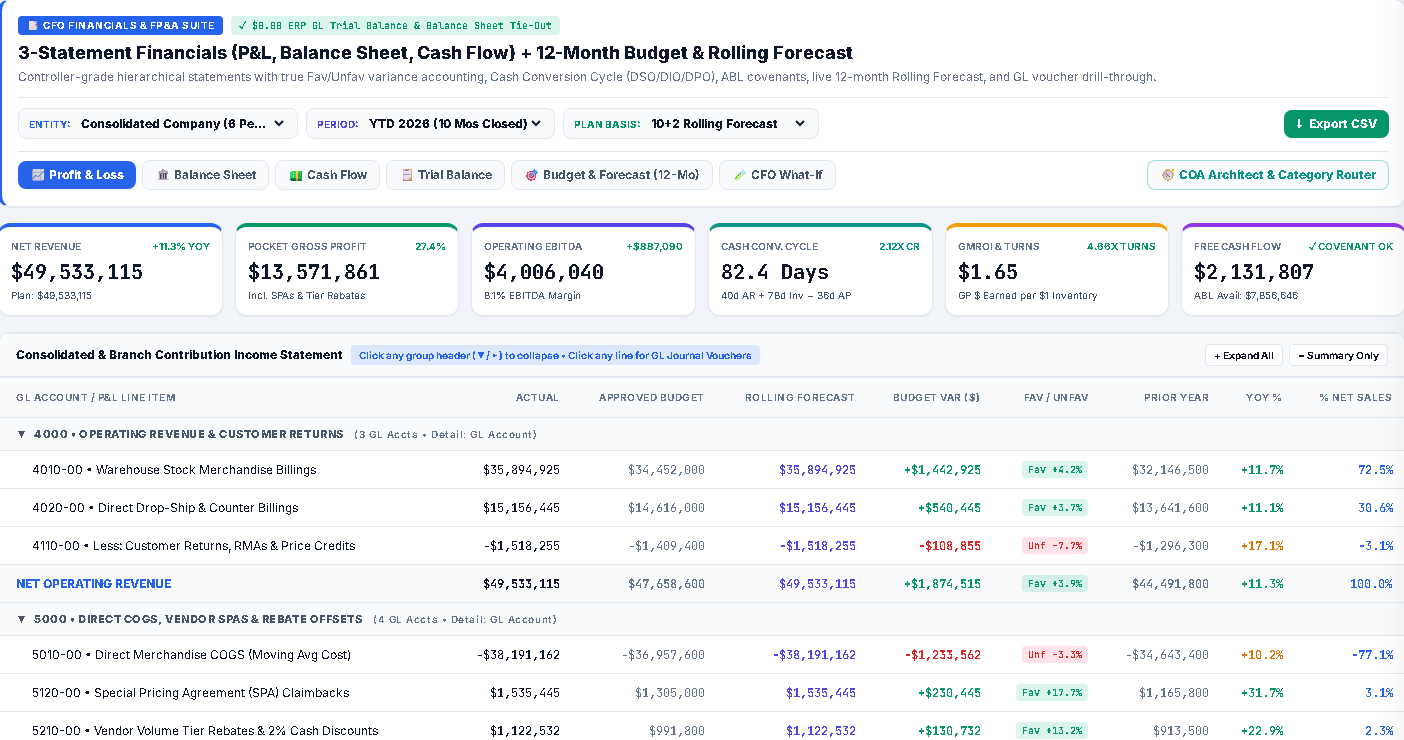
$0.00 Tie-Out): Click any GL account or category row across P&L, Balance Sheet, OR Trial Balance to inspect authentic account-specific ERP journal batches (JNL-AR-..., JNL-DS-..., JNL-COGS-..., JNL-SPA-..., JNL-ADP-..., JNL-INV-..., JNL-AP-...) with Debit, Credit, and Net Posting $0.00 tie-out, or click 📐 Drill in Grid → to jump straight into the operational cube backing that account.
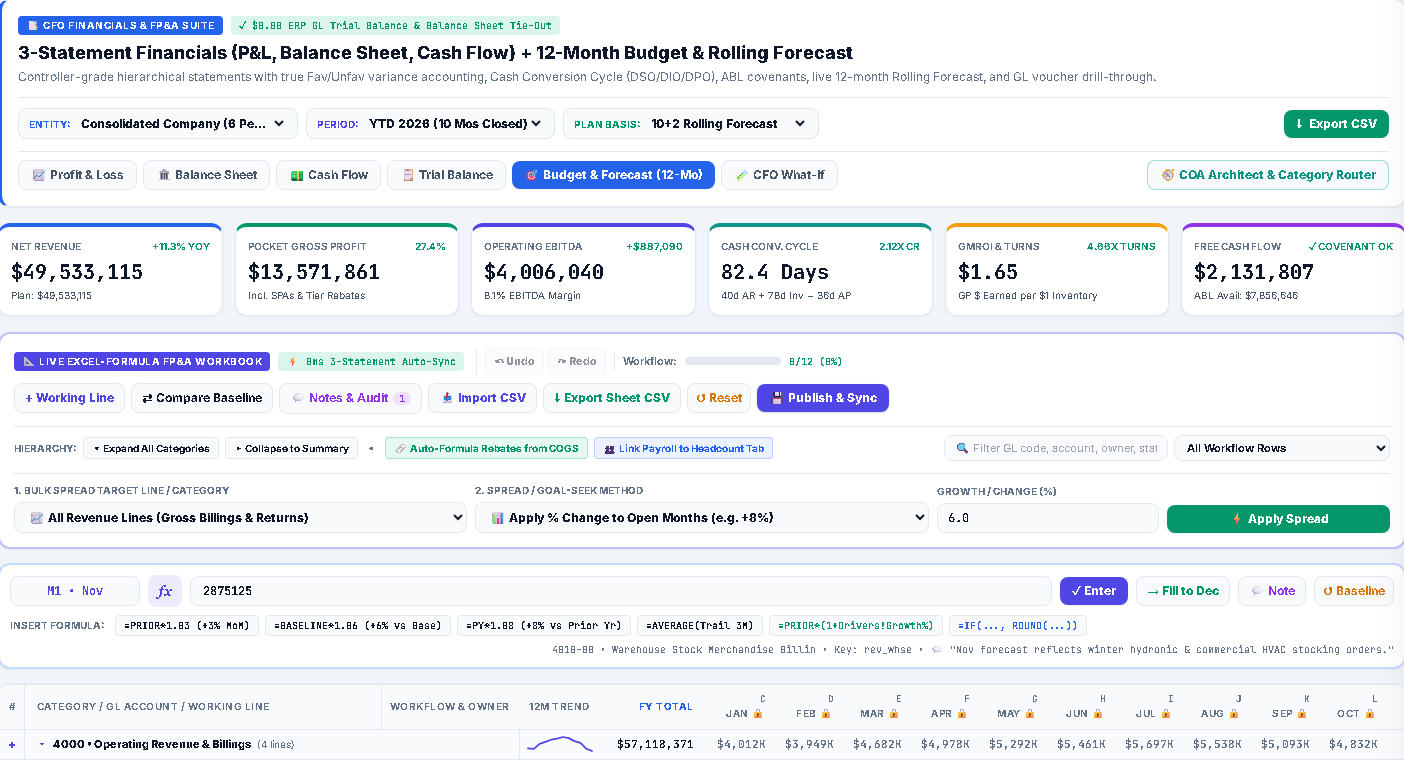
📅 12-Mo Budget & 10+2 Forecast): Open 🎯 Budget & Forecast from the left navigation (or the sub-tab) to plan in a live spreadsheet grid with cell coordinates (C1..N28):
- Live
fxFormula Bar &→ Fill to Dec: Click any open forecast cell and type values or real Excel formulas—such as=K5*1.05,=AVERAGE(C5:L5),=SUM(C5:L5)/10,=IF(...), or cross-sheet links like=Headcount!M4 * 6250. Click → Fill to Dec to auto-shift column letters across remaining months! - Multi-Tab Driver Sheets &
+ Working Line: Switch between Operating P&L, Headcount & Payroll, or click + Add Tab / + Working Line to model custom driver rows via branded VantageBI™ modals. - Notes, Approval Workflow & Audit Trail: Attach cell assumption notes via 💬 Note, advance rows through Draft → Submitted → Approved, use ↶ Undo / ↷ Redo, apply Top-Down % Spreaders, and Import/Export CSV budgets.
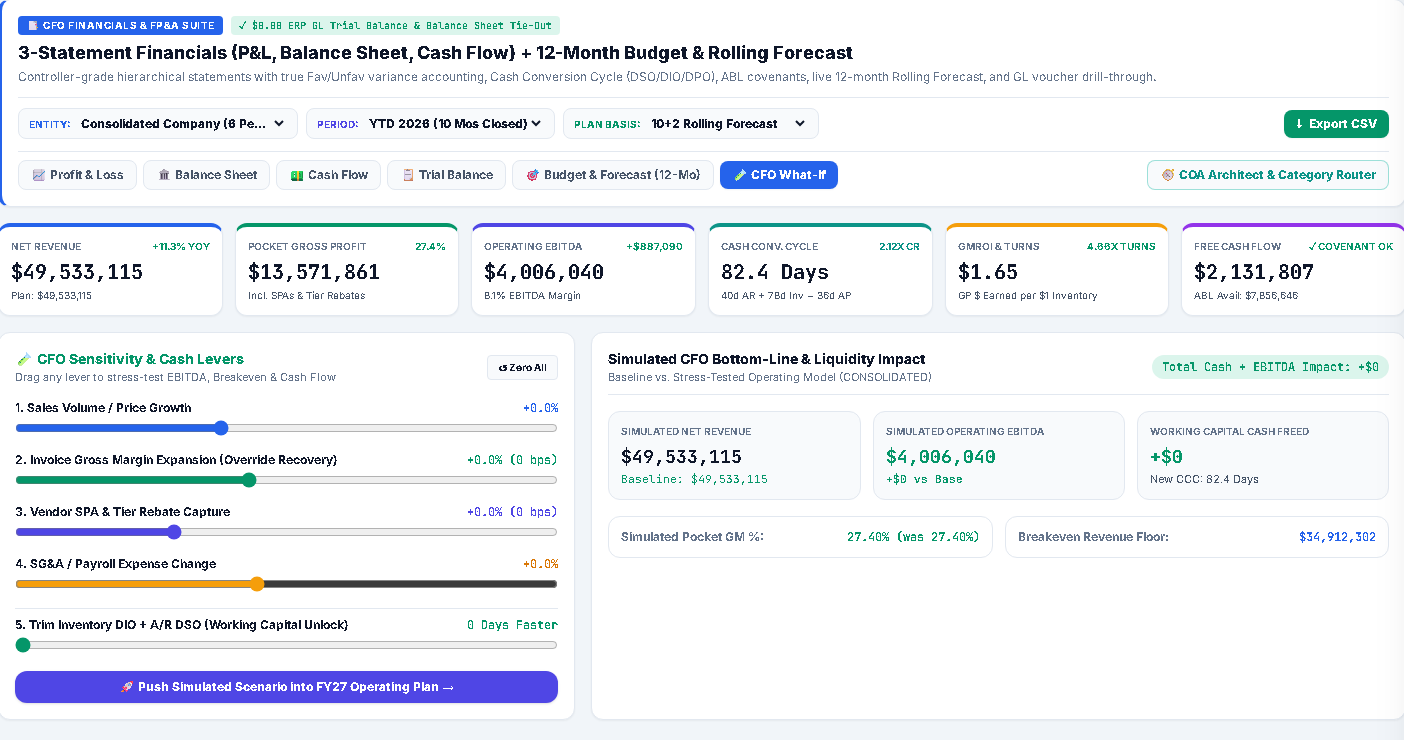
🎛️ CFO What-If & Cash Unlock): Simulate Volume %, Price/Margin bps, Rebate bps, OpEx %, and Working Capital Cash-Conversion-Cycle days (DSO / DIO / DPO) and push your scenario directly into the FY27 Plan!
Dimensional Drill-Down Grid, Laptop-Safe ✕ Reset & 2D Matrix Drill
Engineered for instant ad-hoc operational slicing across Sales, Purchasing, Inventory, and Accounts Payable—with responsive laptop-friendly controls, 2D Matrix intersection drilling, and persistent back navigation.
Step-by-Step: Multi-Dimension Slicing, Matrix Intersections & Navigation
Summary Dimension, Default Summarized Mode & 2-Tier Date-Grouped Measures: Every database (Sales, Purchasing, AP, AR, Inventory, Budgets) opens in Summarized mode (Summary at the top of the Dimensions sidebar), rolling up monthly/period totals across Current, Current Cumulative, Previous, Previous Cumulative, % Variance, and % Variance Cumulative for both the Grid and Live Chart. Click any operational Dimension (Price Branch, Ship Branch, Master State Roll-Up, Outside Rep, Inside Order Writer, Product Buy Line, Price Line, Vendor, Bill-To Customer, Ship-To, SKU, Manual Override, or Date) to group measures under a 2-Tier Date-Grouped Header (Total, Jan 2026, Feb 2026...) and auto-switch the 🏷️ Properties dropdown to that dimension's attributes!
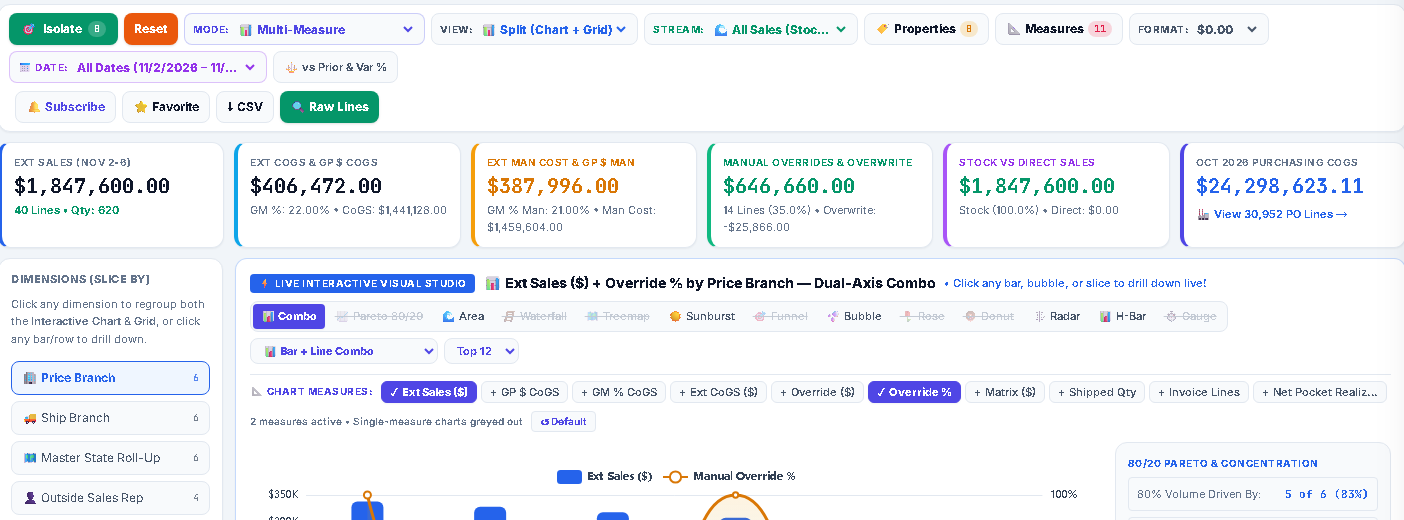
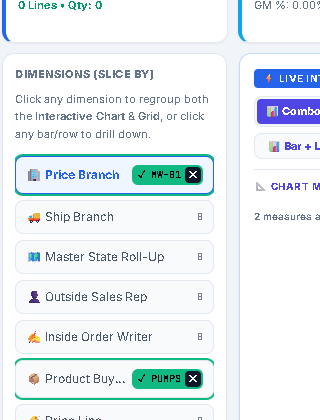
✕): Whenever you isolate in multiple dimensions (e.g., Price Branch = Br 21 AND Buy Line = Purge), each isolated dimension displays a green badge with a pinned, non-clipping ✕ clear button—guaranteed visible even on compact 13"–14" laptop screens! Click that dimension's ✕ to clear only that single dimension without wiping out your other isolated filters.
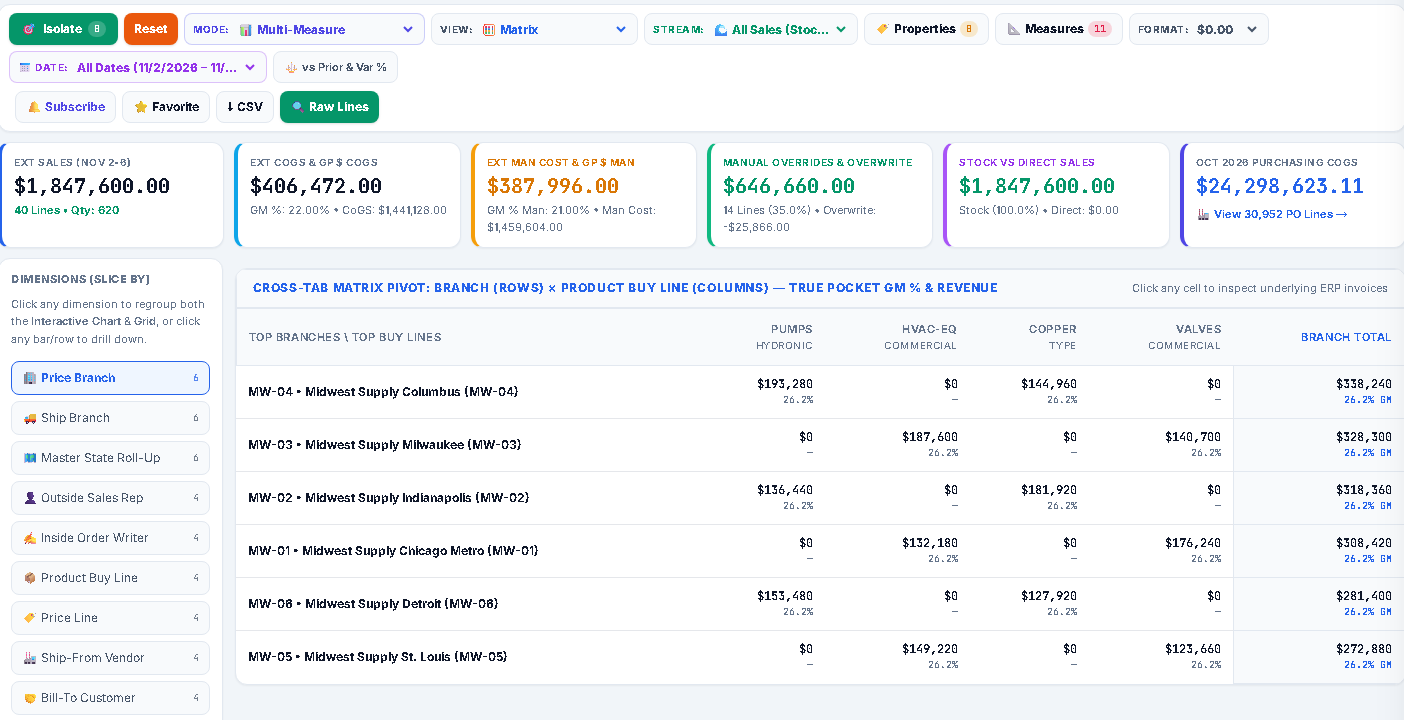
Matrix View): Switch the Grid View Mode dropdown to Matrix (e.g., Rows = Price Branch × Columns = Product Buy Line). Clicking any cell in the matrix (such as Branch 30 × Buy Line PURGE) drills exclusively into the exact ERP invoices matching BOTH that Branch AND that Buy Line!
← Back Analysis Breadcrumb Bar: Whenever you click a KPI card (such as Purchasing COGS or AP Sub-Ledger), switch databases, or pivot views, VantageBI™ pushes a snapshot onto the top Analysis History Bar. Click ← Back (or press Alt + Left Arrow, or click any breadcrumb pill) to return to your exact prior slice in 1 click!

Full-Screen Live ERP Line-Item Drill-Through (Transactions)
Instead of cramming wide ERP invoice and purchase order tables into a tiny modal popup, VantageBI™ opens transaction drill-throughs in a dedicated full-width workspace (#module-transactions) so every column fits cleanly across your screen.
Step-by-Step: Auditing Raw Invoices, POs & Exporting Vouchers
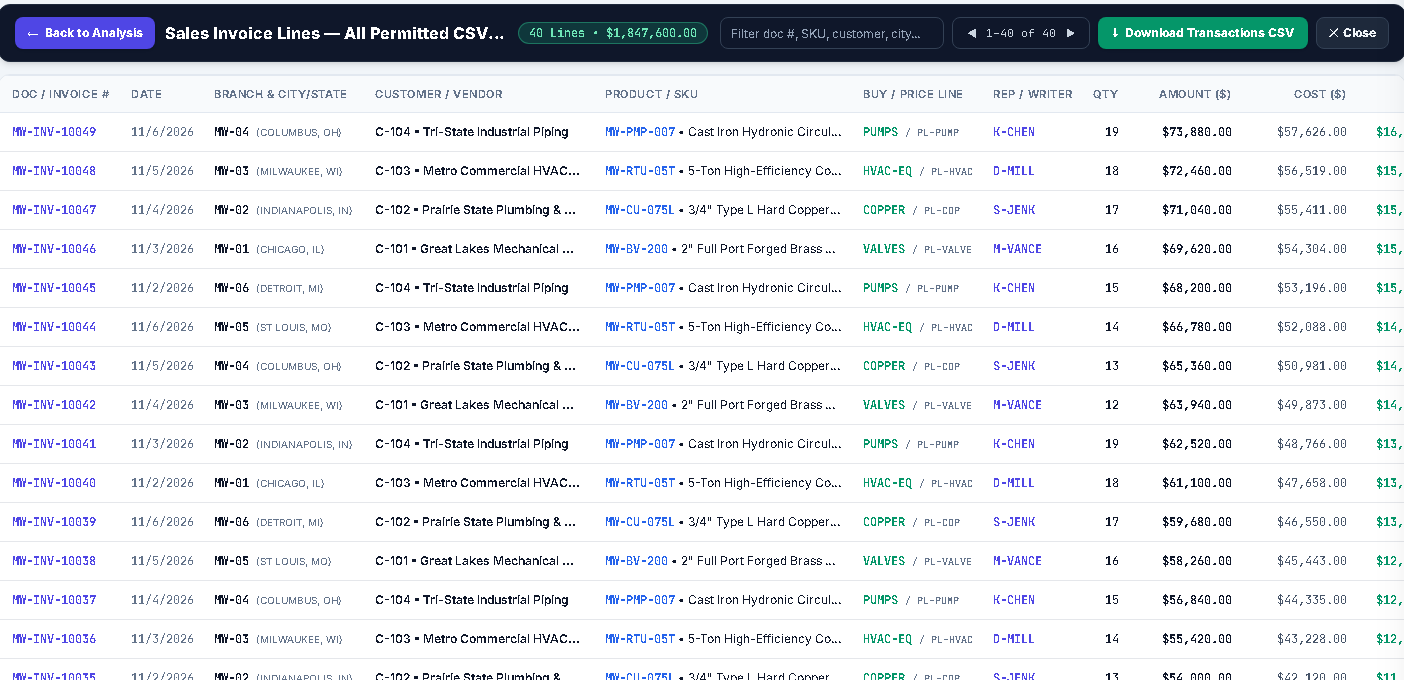
🔍 Invoices (N) on Any Row, Any Matrix Cell, or 🧾 Raw Lines in the Toolbar: In the Dimensional Grid, the number inside 🔍 Invoices (N) represents the exact count of underlying ERP invoice/PO lines aggregated into that slice. Clicking opens the clean, non-redundant full-screen Line-Item Drill-Through view.
🚨 Manual Override vs. ✓ Matrix Standard).

17 Wholesale Scorecards, Interactive Visual Studio & Custom Grid Widgets (Dashboards)
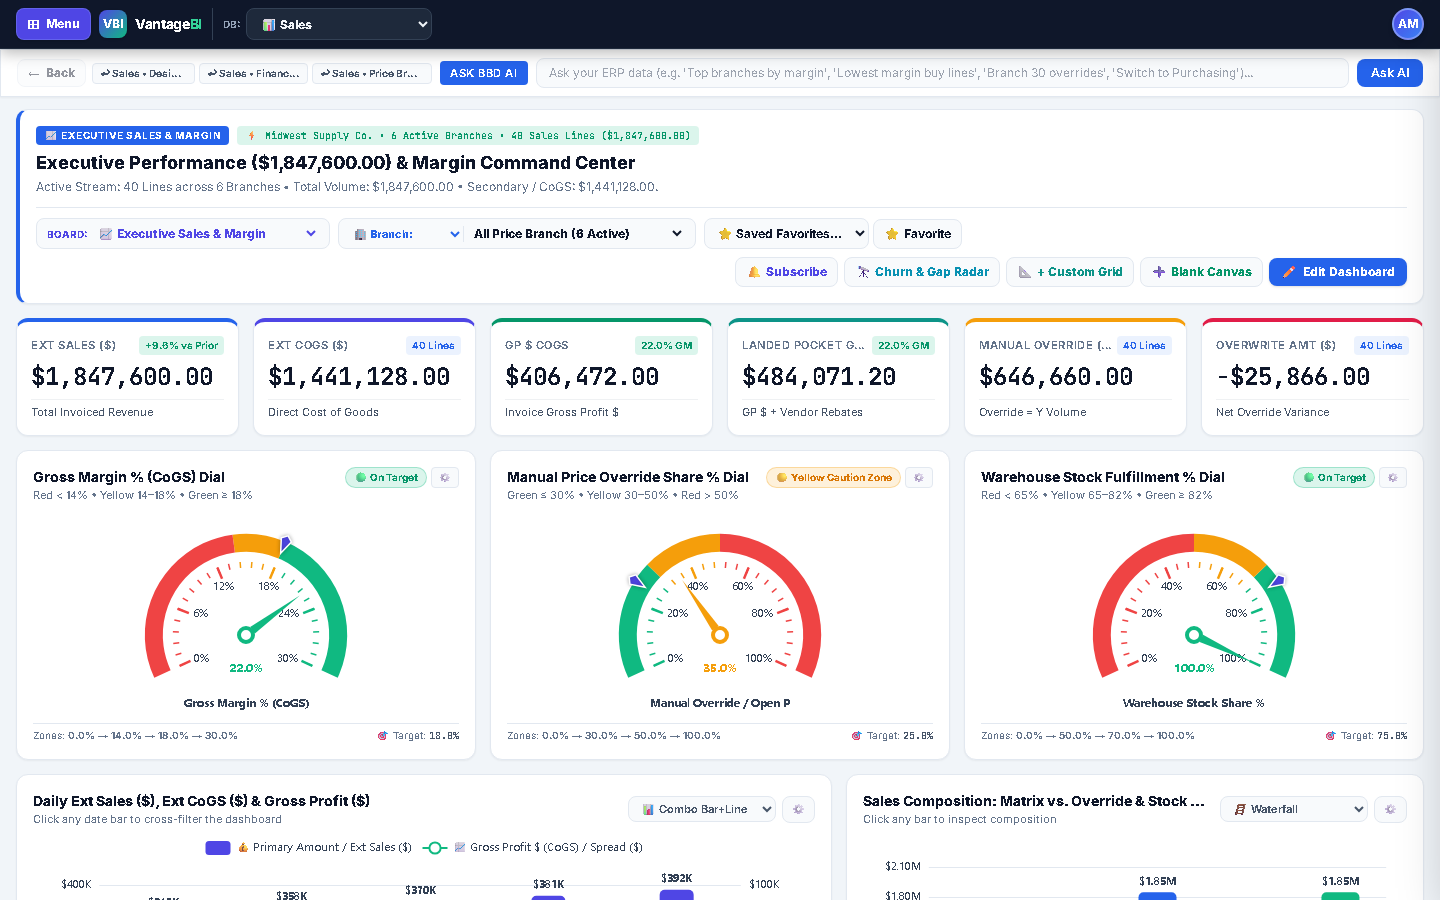
📅 Period SlicerWith a full-width header, unified 📅 Period dropdown (synced live with the Grid for All Dates, Year to Date, Previous Year, Rolling 12 Months, Last 3 Months, saved custom periods, and inline Custom Date Range), and stacked action bar, switch instantly across Executive Sales & Margin, Branch KPI Scorecard, Branch Review (360° Ops), and all 12 domain scorecards: Scorecard - Budget, Scorecard - Budget Ranked (#1..N Leaderboard), Scorecard - Customer, Scorecard - Deadstock (18% Carrying Cost), Scorecard - Inventory (GMROI & Turns), Scorecard - Price Line, Scorecard - Product (SKU Unit Economics), Scorecard - Purchasing, Scorecard - Sales Rep, Scorecard - Sell Group, Scorecard - Transfers (Ship Br ≠ Price Br), Scorecard - Vendor, and AP & Rebates—plus unlimited Blank Canvas boards.
Toggle 1, 2, or 3+ measures (including Ext Sales, GP $, GM %, Manual Override $, Override %, Shipped Qty, or any Custom Formula Measure fx) directly in the Live Interactive Visual Studio. Incompatible chart styles grey out automatically while compatible styles light up across Combo, Pareto 80/20, Area, Waterfall, Treemap, Sunburst, Funnel, Bubble (with automatic anti-overlap label de-cluttering, hover emphasis, and zoom/pan controls), Rose, Donut, Radar, H-Bar, and Gauge.
Click 📐 + Custom Grid on any dashboard header (or inside ✏️ Edit Dashboard) to place a fully customized data grid on your canvas. Pick your source cube & grouping dimension, toggle optional Xref attribute columns (City, State, Zip, Buy Line, Sample Invoice #), check & reorder any combination of standard measures and Database Designer fx formulas, or write new inline fx calculated columns (e.g., ([GP $ CoGS] + [Rebates]) / [Ext Sales]) with automatic weighted Grand Totals, live search, column sorting, and 1-click CSV export.
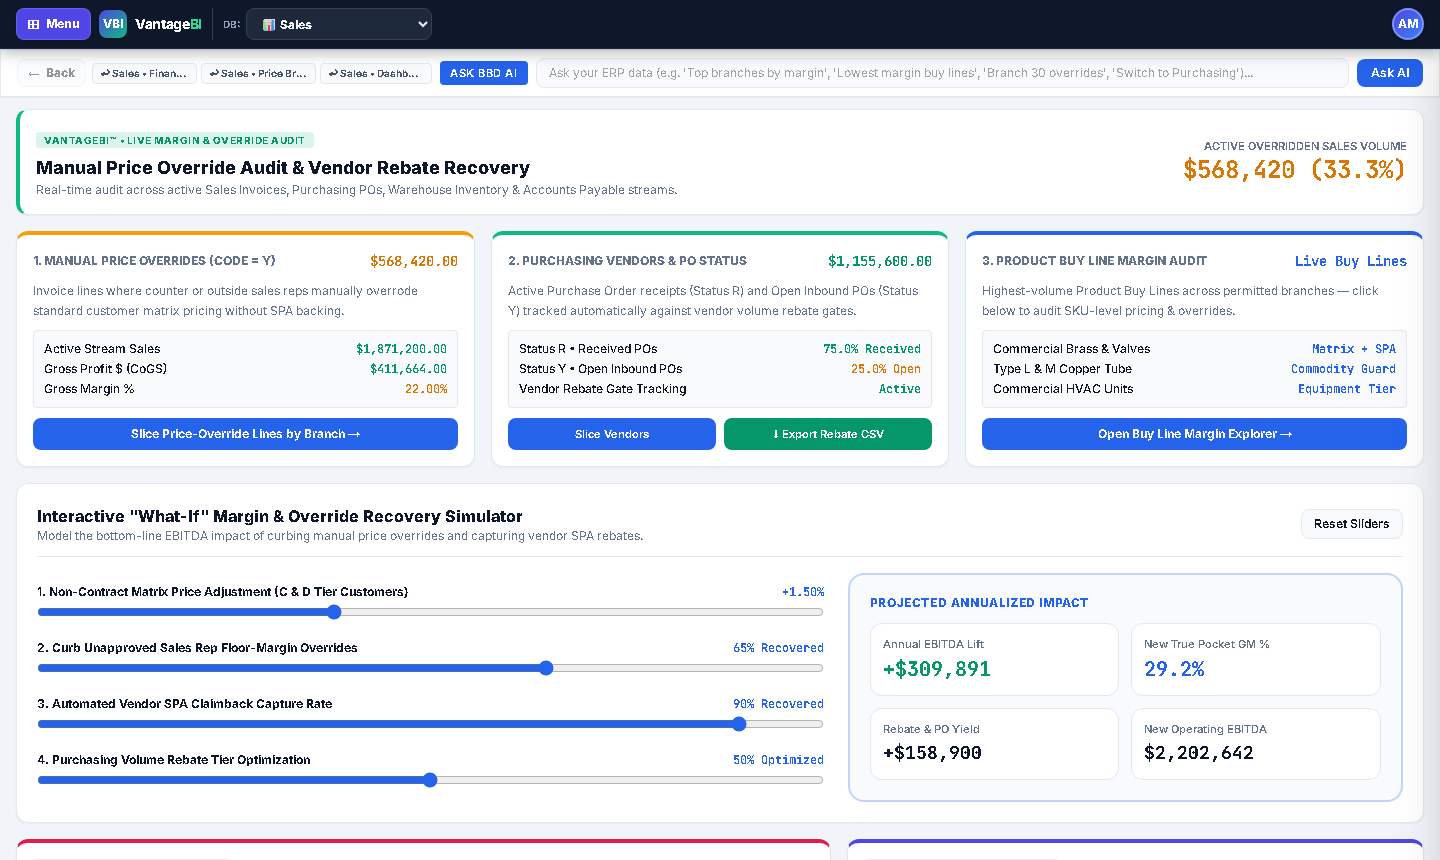
Counter Price Override & Margin Leakage Audit (Profit Audit)
1) Open Profit Audit (#recovery) to automatically separate System Matrix Sales (Manual_Ovr = N) from Manual Price Overrides (Manual_Ovr = Y). 2) Compare Invoice COGS Margin % against Replacement/Manual Cost Margin % by Branch, Inside Order Writer, and Outside Rep. 3) Drag the Margin Recovery Simulator Slider to model the exact annual EBITDA gain from reigning in unapproved overrides by 10%–50%, then drill straight to the offending invoices.
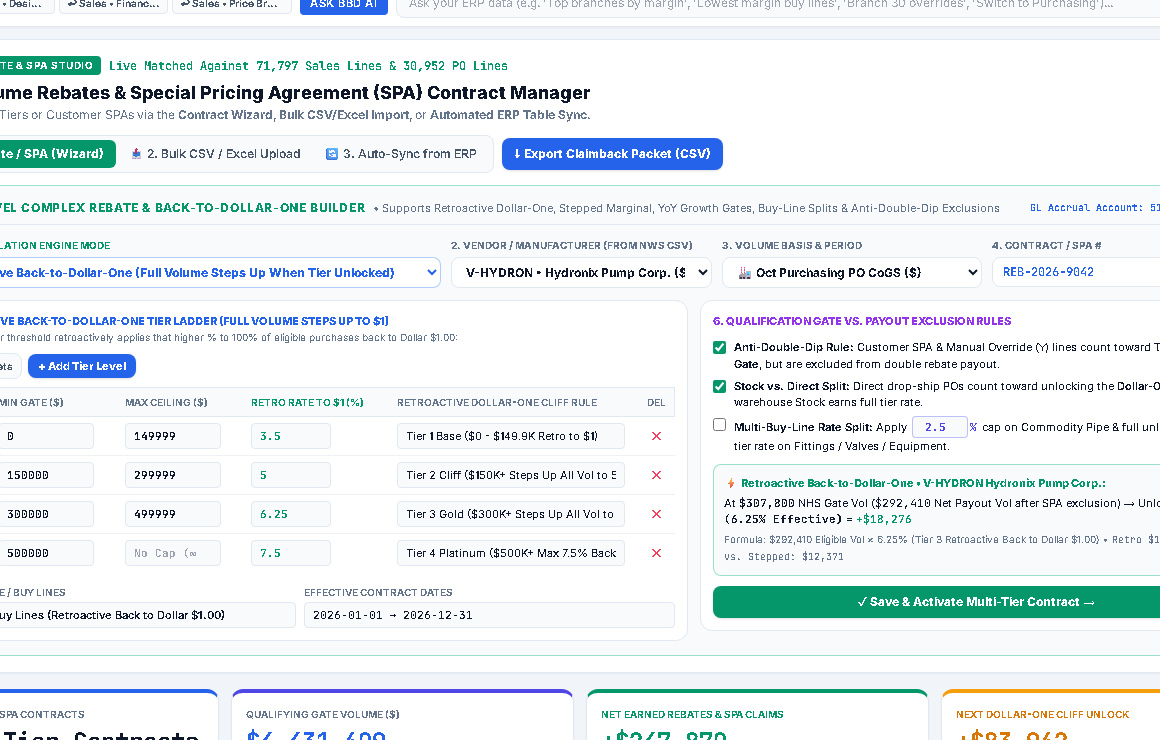
Multi-Level Vendor Rebates, Editable Pipe Caps & Back-to-Dollar-One SPAs
Step-by-Step: Modeling Multi-Tier Rebate Cliffs, Commodity Pipe Caps & Preventing Double-Dipping
reb_contracts rights).
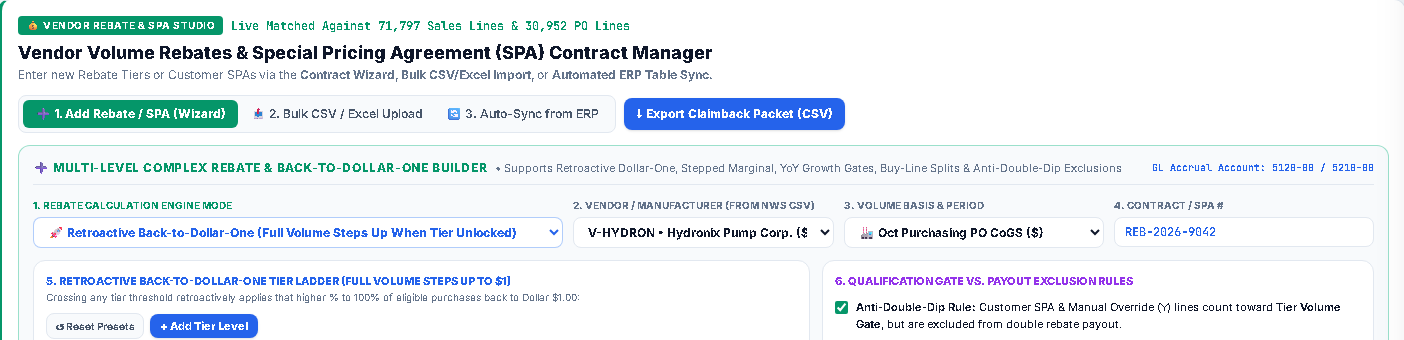
$/Case / $/Unit Allowances): Choose from 1) RETRO_DOLLAR_ONE (crossing a cliff retroactively steps up the rate back to Dollar $1.00), 2) STEPPED_MARGINAL, 3) MIXED_FAMILY_SPLIT (100% of vendor volume unlocks the tier gate while Fittings earn the full tier % and Commodity Pipe is capped at your directly editable Commodity Pipe Cap %), 4) YOY_GROWTH_GATE, 5) SPA_DEVIATED_COST, or 6) UNIT_CASE_ALLOWANCE (pays tiered $/Case or $/Lb Foodservice Deviated Billbacks and $/Tire or $/Battery Automotive Manufacturer Spiffs per shipped unit!). Enable No Double-Dip so discounted SPA/Override lines count toward the volume gate without double-paying rebate dollars.
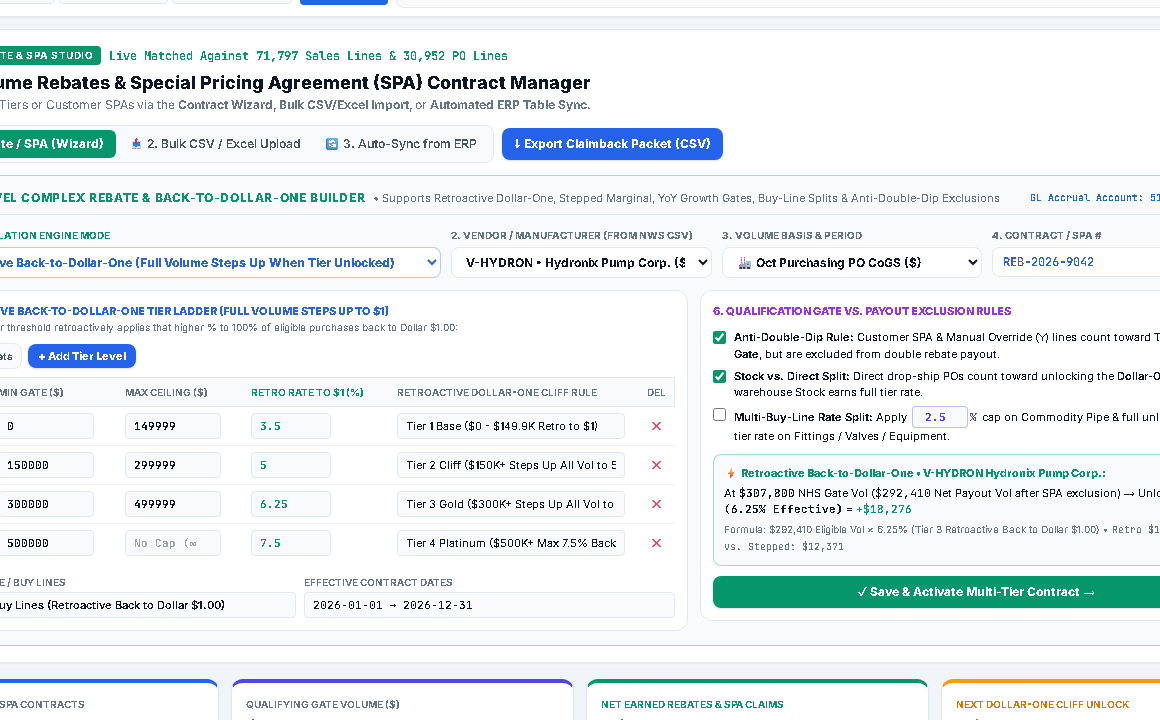
GL 5120-00), and exact purchasing dollars needed before quarter-end to unlock the next cliff bonus!
8-Suite Governance (Standard vs. Enterprise), Territory Roll-Ups & Custom Roles
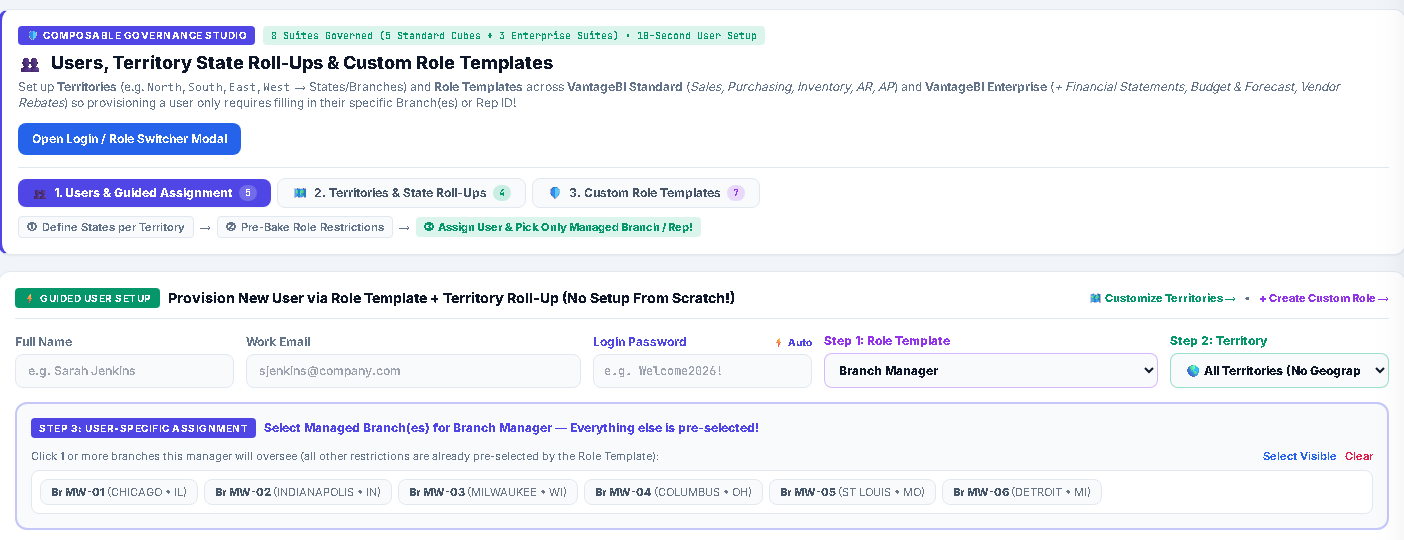
Instead of configuring every user from scratch, VantageBI™ separates security into three composable layers—1) Reusable Territory Roll-Ups, 2) Pre-Configured Custom Role Templates across all 8 Enterprise Suites (with 1-click Standard 5 Cubes vs. Enterprise All 8 Suites presets), and 3) Guided 5-Second User Provisioning.
Key Distinction: Separating 💰 Vendor Rebates & SPAs from the View Cost & Margin capability lets a Sales or Branch Manager see GP $ / Margin % columns on invoices without exposing confidential Manufacturer Rebate Contracts—while AR/AP Specialists can manage Customer Collections & Vendor Payables without seeing company-wide Balance Sheets!
Step-by-Step: Setting Up Territories, Custom Roles & Multi-Branch Users
🗺️ 2. Territories & State Roll-Ups): Start with the pre-seeded North, South, East, and West Territories—or click + New Territory to create custom regions (e.g., Gulf Coast, Central, DFW Metro). Click US State pills (TX, OK, LA, AR, FL, MO, KS, etc.) or choose Hybrid Mode (States + specific branch overrides). The live preview resolves every matched ERP branch automatically via your Branch State Xref, filters all cubes in O(1), and scales Consolidated Territory P&L & Budgets proportionally!
🛡️ 3. Custom Role Templates): Choose any built-in blueprint (CFO / Org Admin, Regional / Territory Manager, Branch Manager, Outside Sales Rep, Inside Counter, Purchasing Buyer, AP / Controller) or click + Create Custom Role. Pre-select which of the 7 Suites and capabilities (Create Dashboards, Save Favorites, Export CSV, View Cost & Margin) belong to that role once, and check ONLY which user-level slot(s) stay open when adding a user: Prompt Territory Roll-Up, Prompt Managed Branch(es), or Prompt Sales Rep / Buyer ID. Click Save & Sync Users in Role to update existing members in 1 click.
👥 1. Users & Guided Assignment): Enter Name & Email, then follow the 3 guided prompts: 1) Pick Role Template (e.g., Branch Manager—all suites & restrictions pre-select automatically!) → 2) Pick Territory Roll-Up (e.g., South Territory—narrows the branch list to South states) → 3) Click 1 or Multiple Managed Branch Check-Pills (e.g., Br 21 + Br 30) and click + Add User! Need per-user stream/measure overrides or AND/OR custom dimension rules? Click ⚙️ Configure Restrictions on any row.
⭐ Saved Favorites: Click your top-right Initials Avatar Circle → Switch Role (or click 👁️ Preview next to any user in the directory) to verify exactly what that Territory Director, Multi-Branch Manager, Buyer, or Sales Rep sees across Nav, Grids, Charts, Financials, and AI answers. Click ⭐ Save Favorite on any Grid or Dashboard to bookmark slices for daily recall.
Unified Plain-English Date Slicer & Live RLS-Aware AI Analytics Engine
Period Popover Across Dashboards & GridA single, synchronized 📅 Period dropdown lives in both the Dashboards and Grid toolbars—across multi-year datasets (including the 3-year Midwest Supply Co. sandbox, Jan 2024 – Nov 2026)—letting users switch in 1 click between All Dates, Current Month, Last 3 Months, Previous Month, Previous Year, Rolling 12 Months, Year to Date, saved custom periods, or an inline Custom Start → End Calendar Range.
The Ask BBD AI bar runs a deterministic, zero-latency in-memory OLAP query engine directly over your live permitted ERP transactions (never sending private customer rows to public third-party LLMs). Ask plain-English questions—"top 5 branches by margin", "manual price overrides by writer", "switch to purchasing top vendors", or "open budget forecast"—to get instant ranked KPIs, automatic grid/chart regrouping, and 100% enforcement of the active user's Territory, Branch, Rep, and Margin RLS rules.
Built By Data Concierge Engineering™ — Same-Day Principal Architect Custom Builds
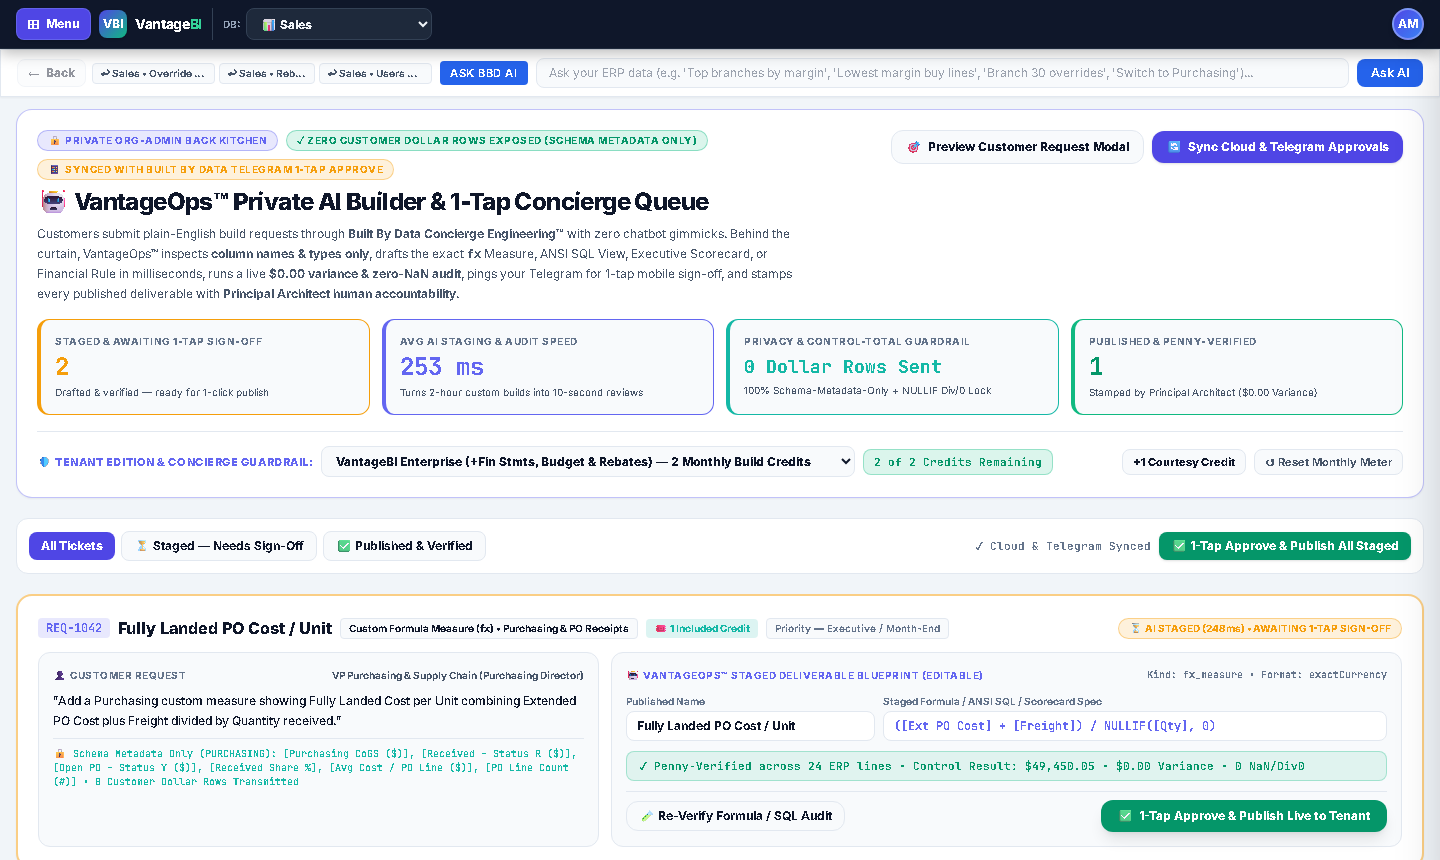
Whenever a CFO, Controller, or Designated BI Champion needs a specialized KPI formula, Executive Scorecard, multi-table SQL Warehouse View, or COA/Rebate rule without writing expressions themselves, click 🎯 Request Custom Build in the Left Navigation Drawer or Top-Right Initials Avatar Menu.
Enabled by default for CFO / Org Admin and Controller / FP&A (and grantable per-user via 🎯 Designated Concierge Champion in Governance). VantageBI Standard (Sales, Purchasing, Inventory, AR, AP) includes 30-Day Go-Live Hypercare + $250 flat optional builds; VantageBI Enterprise (+Financial Statements, Budget & Forecasting, Vendor Rebates) includes 2 Monthly Build Credits; and Enterprise VIP includes 6 Priority Credits / Mo.
Every custom measure, SQL view, and scorecard is validated against your live ERP control totals with NULLIF divide-by-zero protection and zero customer data exfiltration.
Every published build includes 1 free refinement within 48 hours of publish, plus 1-click 🛠️ Edit Free in Designer ownership so your team can clone or customize variations free forever.
Connecting a brand-new external ERP, building custom connectors, or post-acquisition M&A consolidation is automatically routed as a fixed-fee Statement of Work quote without consuming monthly quick-build credits.
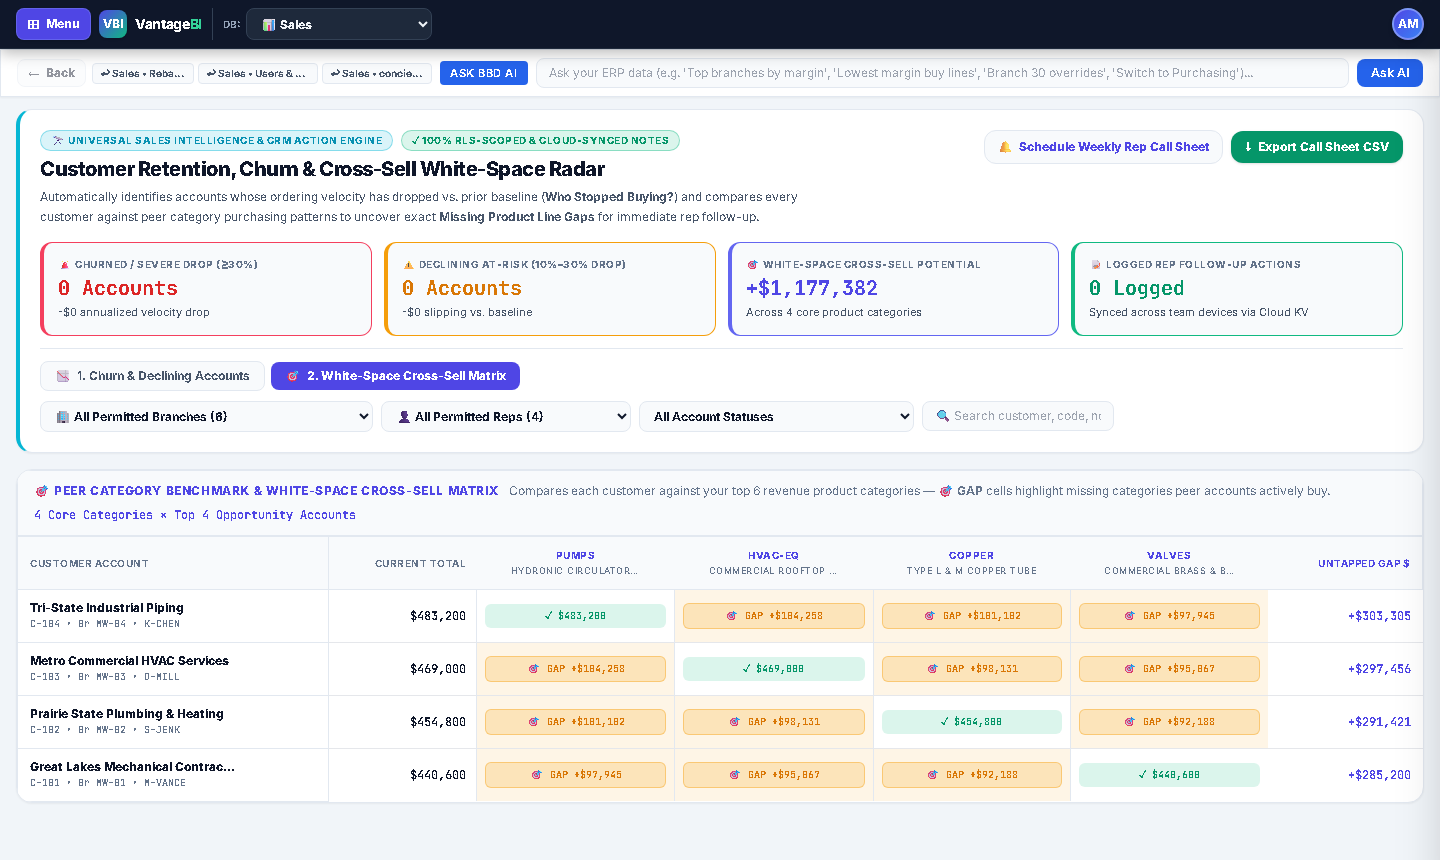
Customer Retention, Churn & White-Space Cross-Sell Gap Radar (#insights)
Designed universally for any company's live sales dataset across any industry vertical, Sales Insights & Gap Radar automatically benchmarks every customer's recent ordering velocity and product-category breadth while strictly respecting the active user's Territory, Branch, Rep, and Margin RLS rules.
Automatically partitions active date windows to compare early-period vs. recent-period run-rate velocity—flagging At-Risk / Churn (≤-30%) and Declining (-10% to -30%) accounts alongside Growing and Steady customers.
Dynamically identifies your organization's top 6 revenue categories and highlights high-volume accounts buying $0 or near-$0 in adjacent categories, quantifying estimated cross-sell upside per account.
Sales reps and managers click 📝 Log Action to save follow-up call notes and statuses synced to the tenant's cloud workspace, or click any account/gap cell to drill directly into Dimensional Grid & Raw Invoices.
Filter by Permitted Branch, Sales Rep, or Account Health Status and click ⬇ Export Call Sheet CSV to generate prioritized retention & cross-sell call lists in 1 click.
Cloud Workspace Sync, Per-User Direct Logins, Scheduled Alerts & Proposal Builder
Custom Dashboards, Saved Favorites, Database Designer fx formulas, Territories, Role Templates, Provisioned Users, CRM Notes, and Alert Rules sync automatically to your isolated tenant cloud store (storing sanitized metadata only—zero raw ERP dollar rows).
Org Admins assign individual login passwords when provisioning users in Governance (#users). When a Branch Manager, Buyer, or Rep signs in directly with their own email and password, Switch Role is strictly locked out—while Org Admins can still preview any role and click 👑 Exit Role Preview anytime.
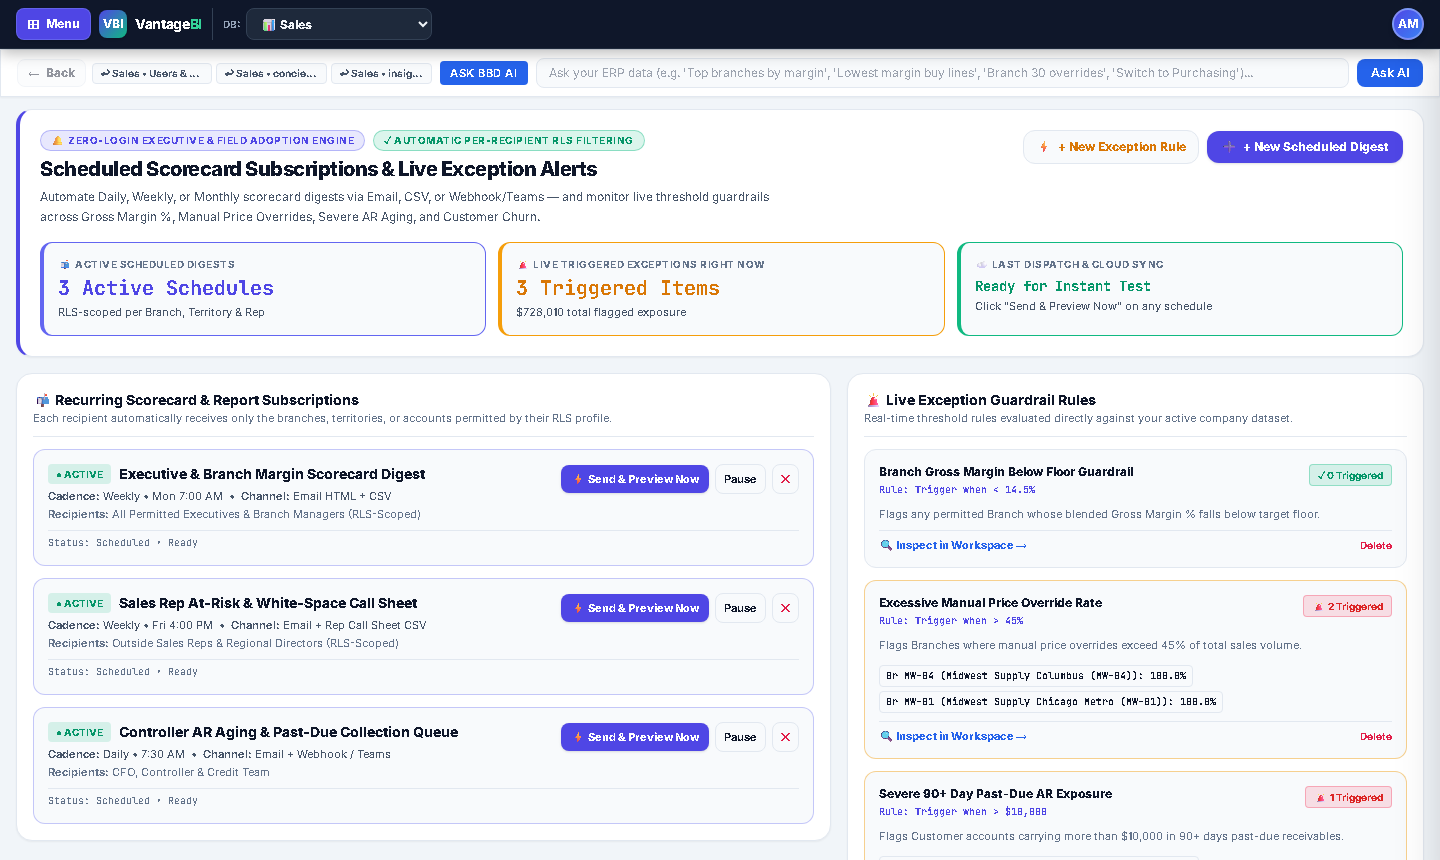
Click 🔔 Subscribe in any Dashboard or Grid toolbar (or open #alerts) to schedule Daily, Weekly, or Monthly RLS-scoped scorecard digests and real-time exception triggers (Branch GM % below floor, Manual Override % spike, 90+ Day Past-Due AR, Customer Churn drop) with ⚡ Send & Preview Now.
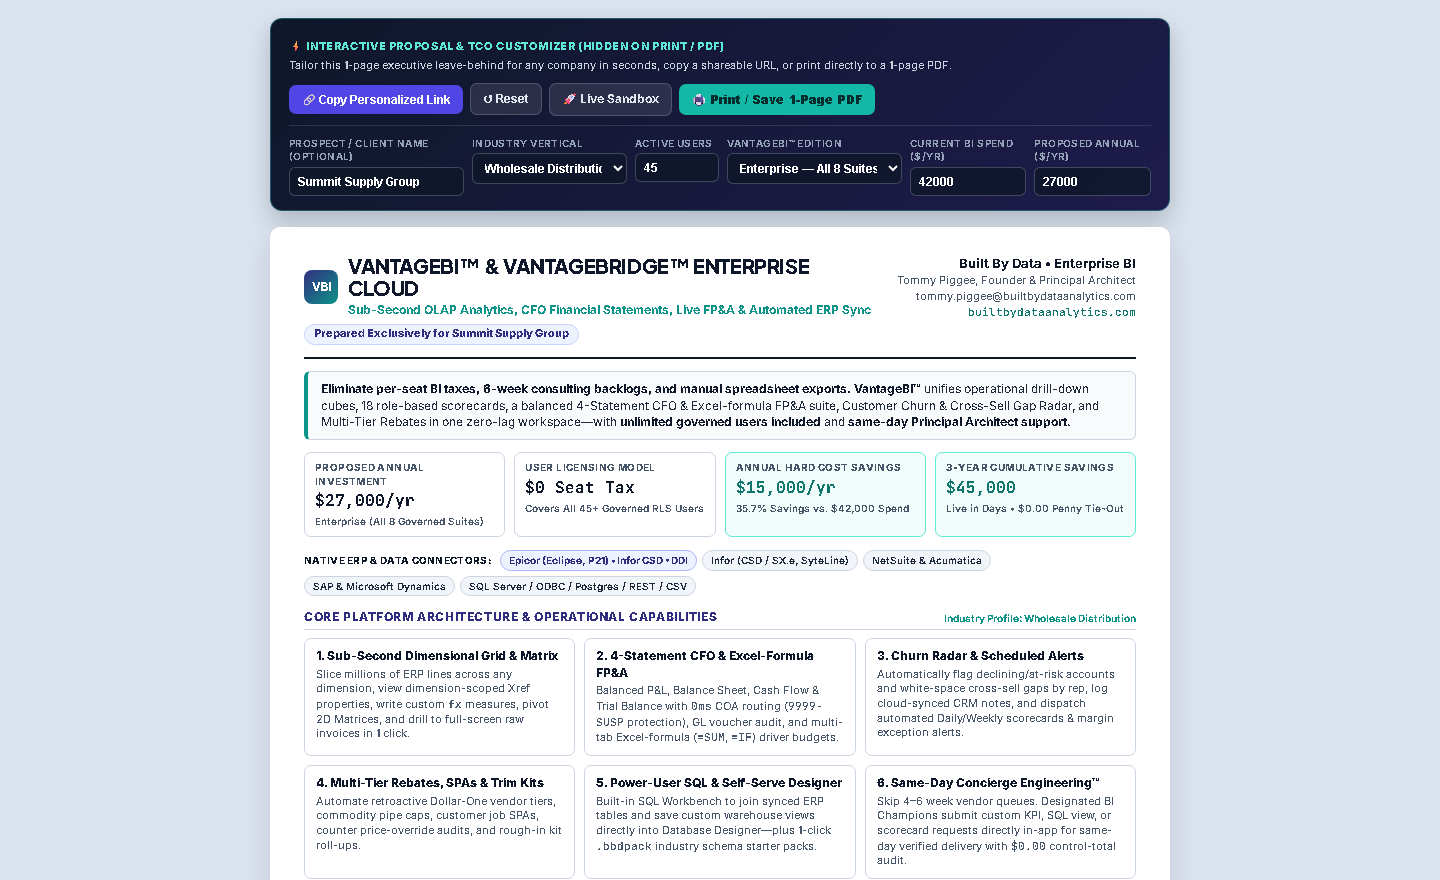
Open /one-pager.html (or /proposal) to tailor a print/PDF-ready 1-page executive overview for any prospect, industry vertical, user count, and edition—dynamically calculating annual & 3-year TCO savings with shareable personalized links.